
Ethereum’s Post‑Fusaka Activity Surge: The Impact of Address Poisoning
State of the Network #349
Ethereum’s Post‑Fusaka Activity Surge: The Impact of Address Poisoning

Introduction
State of the Network #349
Coin Metrics State of the Network is an unbiased, weekly view of the crypto market informed by our own network (on-chain) and market data.
Key Takeaways:
- Ethereum daily transactions increased ~50% and active addresses rose ~60% following the December 2025 Fusaka upgrade, but a portion of this growth reflects address poisoning attacks rather than organic adoption.
- Analysis of 227 million USDC and USDT balance updates reveals that 43% are dust transfers under $1, with 38% under a single penny.
- Post-Fusaka, stablecoin dust is estimated to account for ~11% of all Ethereum transactions and ~26% of active addresses on an average day.
- These findings highlight the value of adjusted metrics that filter low-value activity to better measure genuine network usage.
The Post Fusaka Surge
On December 3rd 2025, Ethereum activated the Fusaka upgrade, enhancing Ethereum’s scalability while lowering transaction costs. Since then, activity on the network has increased substantially. Ethereum is now seeing over ~2M in average daily transactions (spiking to 2.89M on January 16th), 1.5x the levels seen pre-Fusaka. Meanwhile, daily active addresses reached 1.4M, a ~60% increase over prior averages.
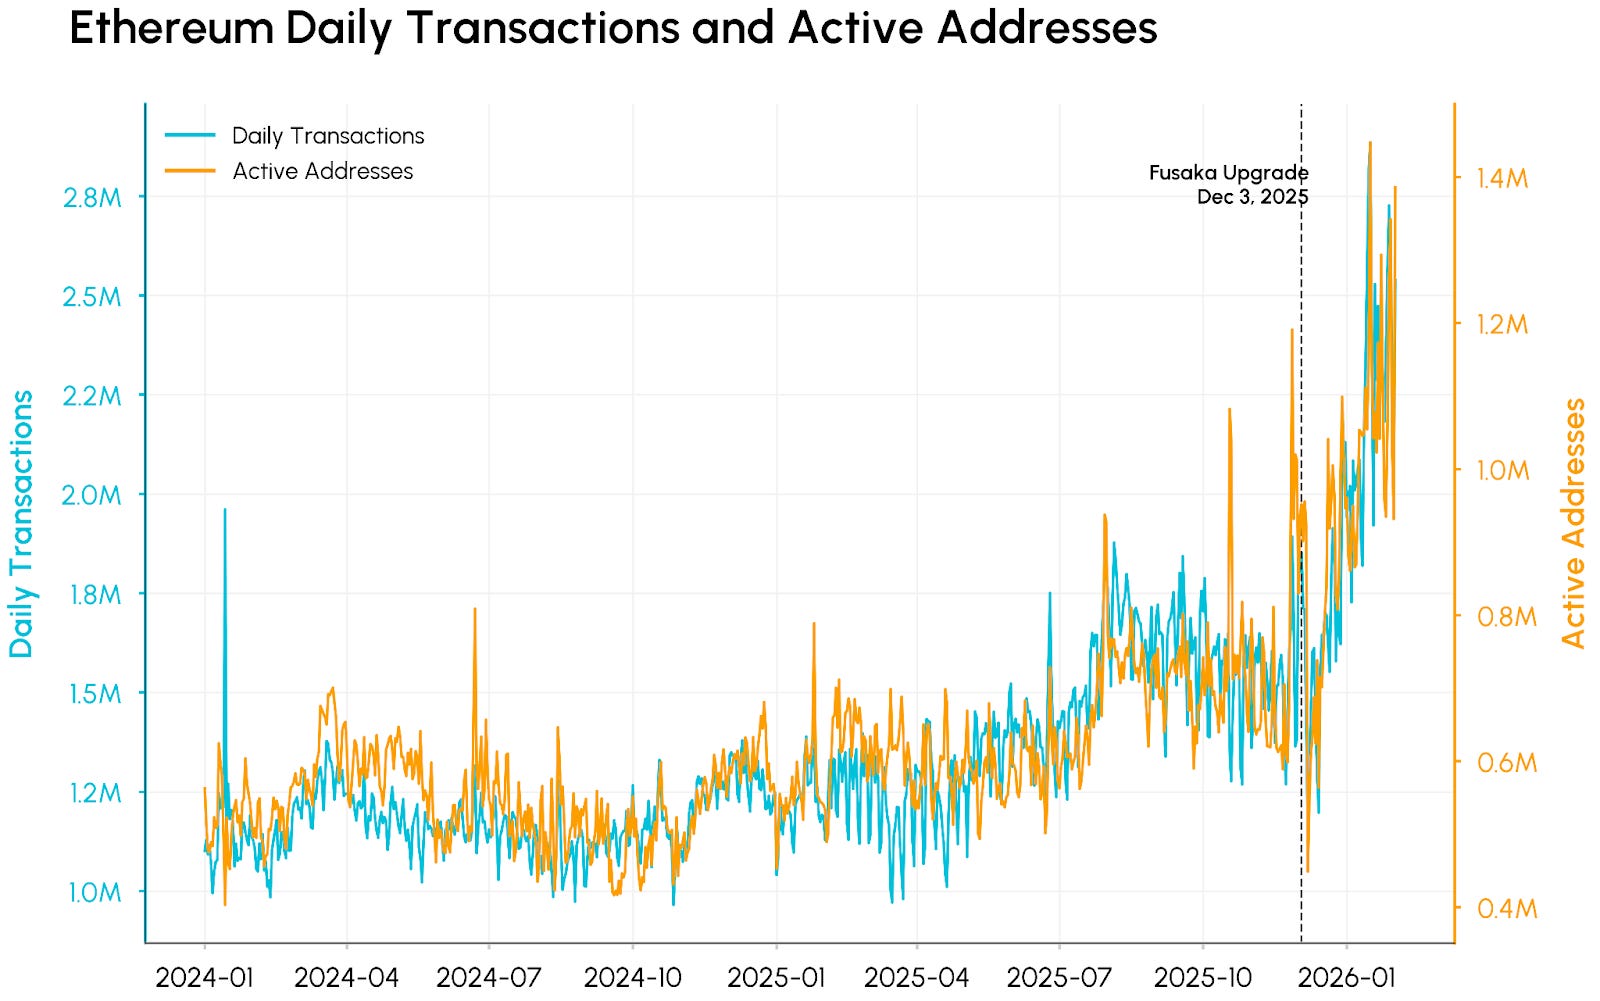
Source: Coin Metrics Network Data Pro
At first glance, this growth appears to suggest the Fusaka upgrade bearing fruit, lower fees enabling broader adoption. However, recent research found that a portion of this rise can be attributed to address poisoning attacks, which have become economically viable now that transaction fees have dropped substantially.
In this issue of State of the Network, we dig into Ethereum’s post-Fusaka activity surge, using Coin Metrics’ ATLAS to quantify the scale of address poisoning and examine its impact on network activity metrics.
What is address poisoning?
Address poisoning is a well-documented social engineering attack that exploits fast-paced, complex nature of blockchain transactions, targeting how users copy wallet addresses from their transaction history. Attackers generate "lookalike" addresses matching the first and last characters of addresses the victim has used, then send tiny amounts (often fractions of a cent) to "seed" the victim's wallet with a poisoned entry. When the victim later copies from their history, they may send funds to the attacker instead.
The attack has been observed across multiple chains and relies on volume. Success rates are extremely low, so profitability requires seeding millions of wallets. Until recently, Ethereum’s gas fees made this uneconomical at scale, but post-Fusaka, that equation changed.
Evidence of Address Poisoning on Ethereum
To explore the presence of address poisoning on Ethereum, we first examined high-level stablecoin metrics. As the largest fiat-backed stablecoins on Ethereum, USDC and USDT provide a clear window into transfer activity onchain. The following observations point to unusual activity:
- The number of transactions below $5 for these tokens saw a steep increase following Fusaka rising from ~50K to ~380K daily and accounting for a substantial share of total stablecoin activity.
- The number of addresses holding small “dust” balances, greater than zero but less than 1 native unit, has grown sharply, consistent with millions of wallets receiving tiny poisoning deposits.
- Median transaction sizes across major stablecoins on Ethereum also collapsed from around $100 to just $0.001, a roughly 100,000x reduction.
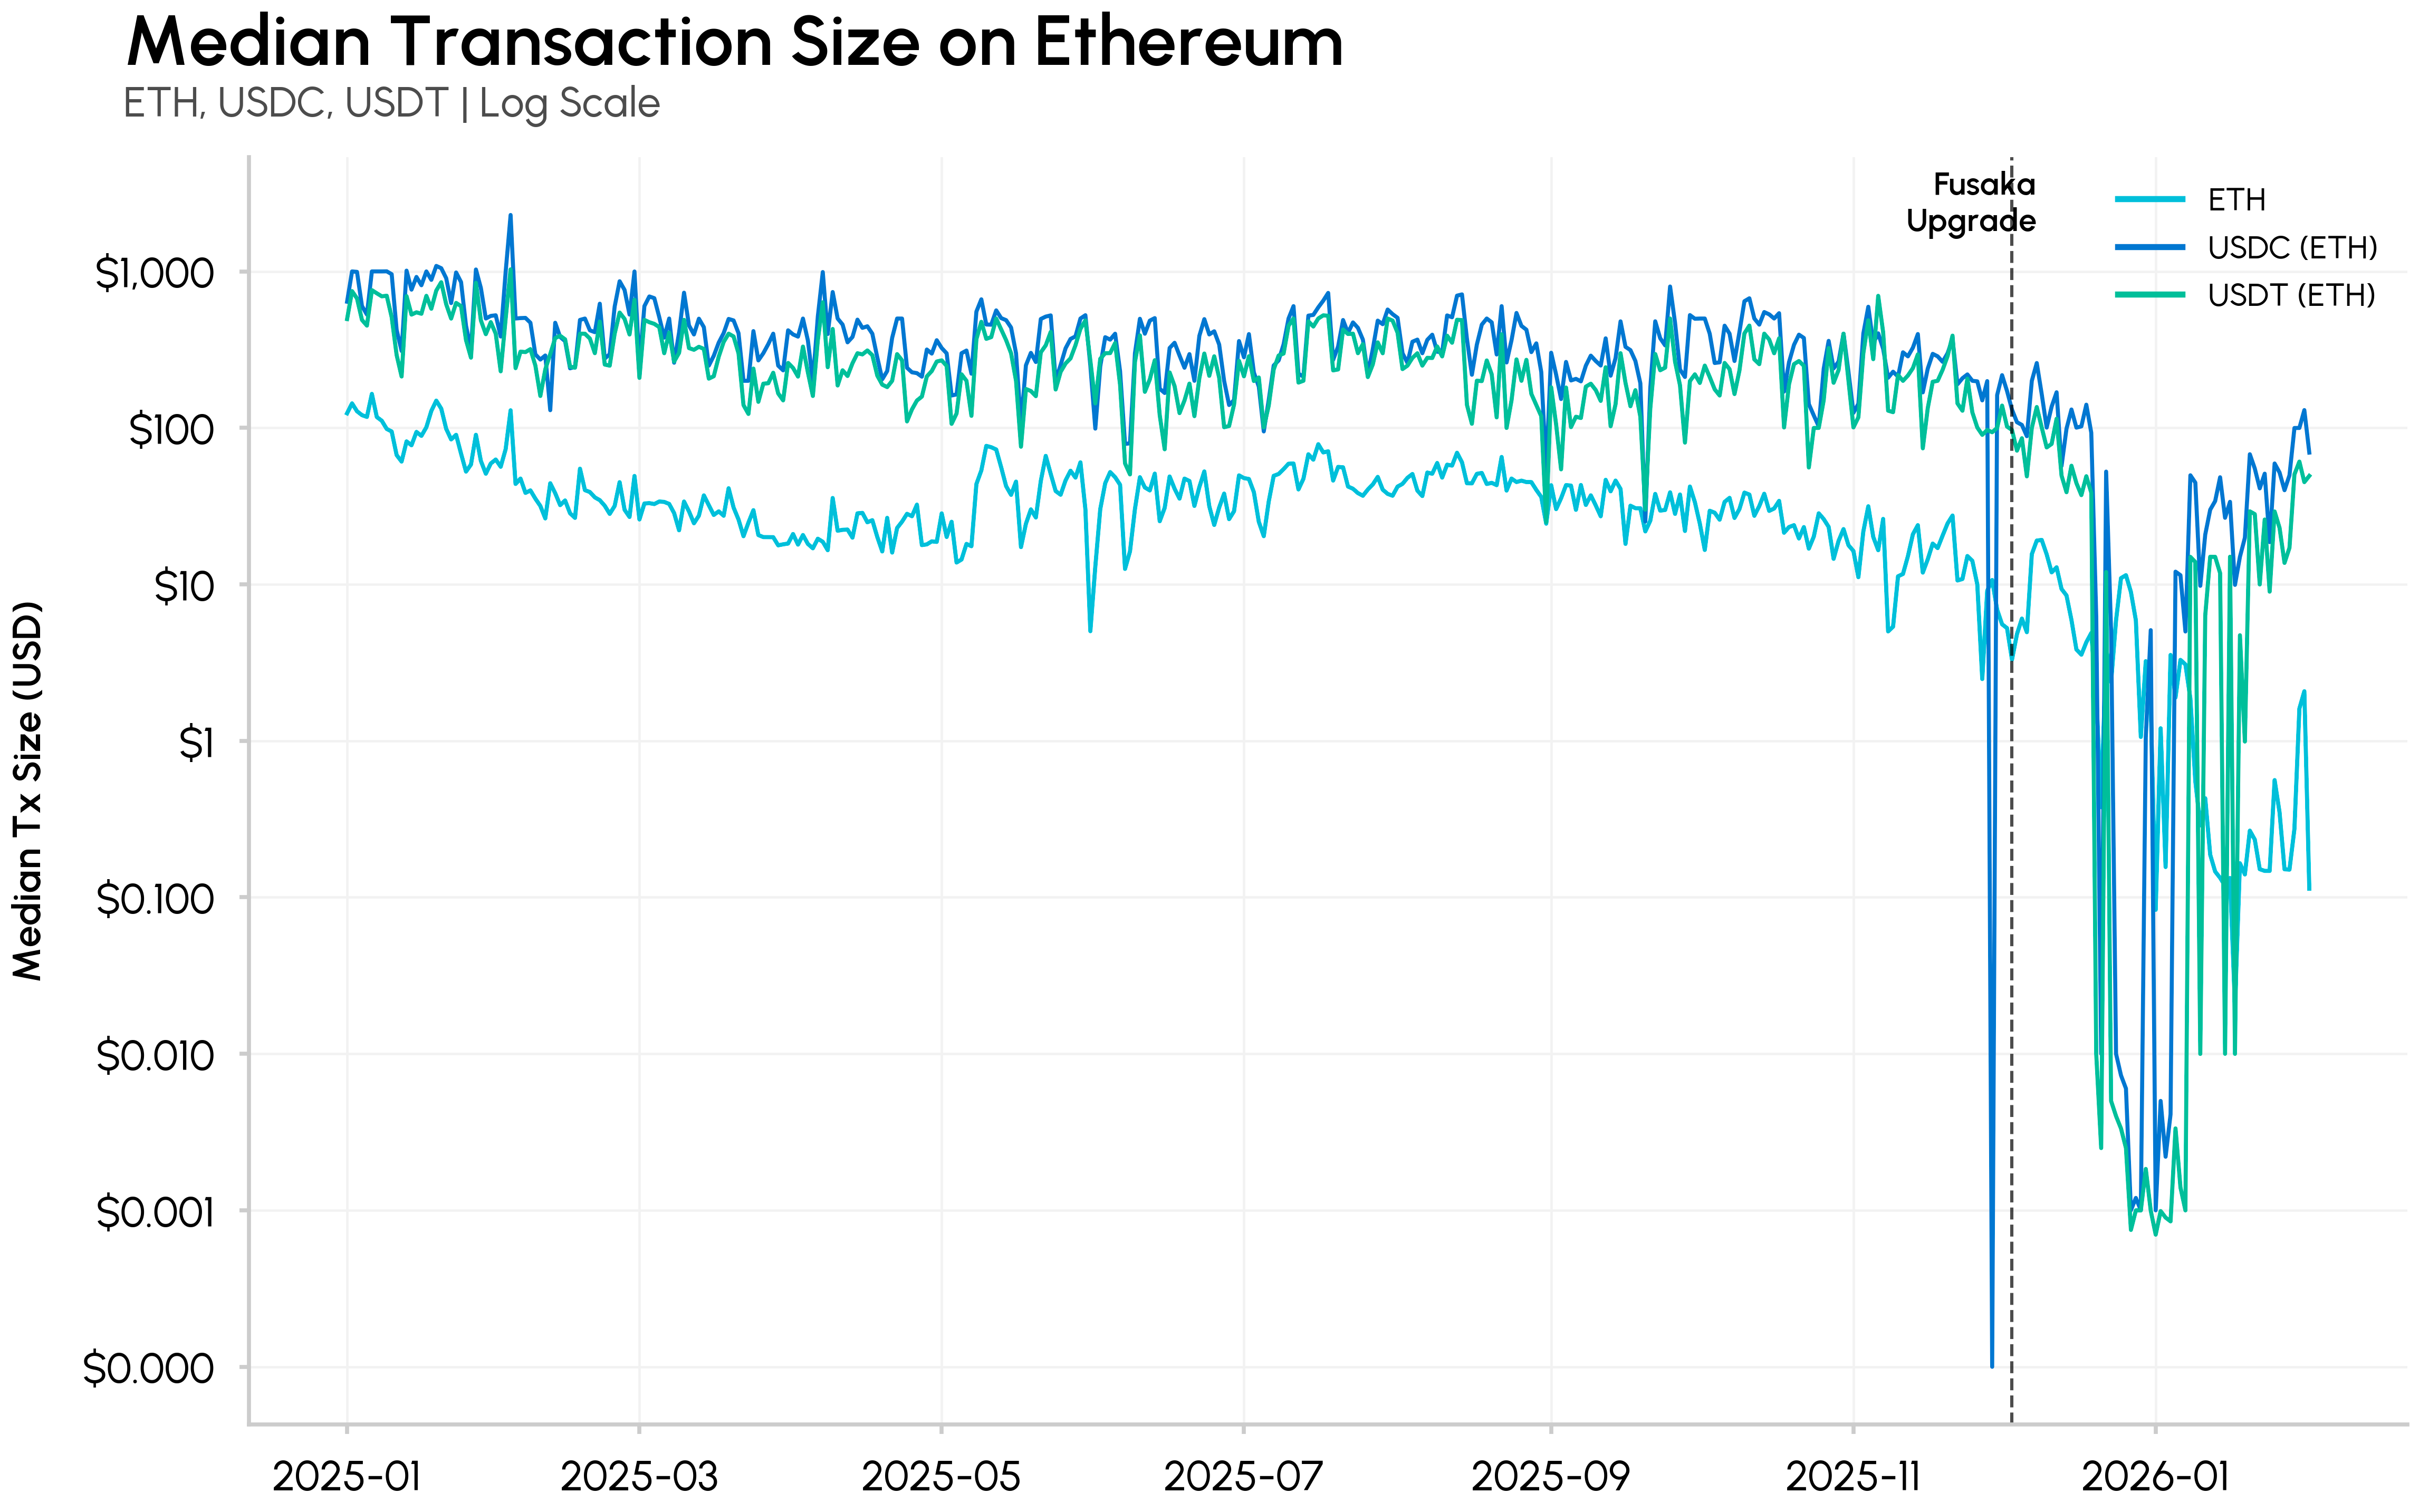
Source: Coin Metrics Network Data Pro
Digging into ATLAS Balance Updates
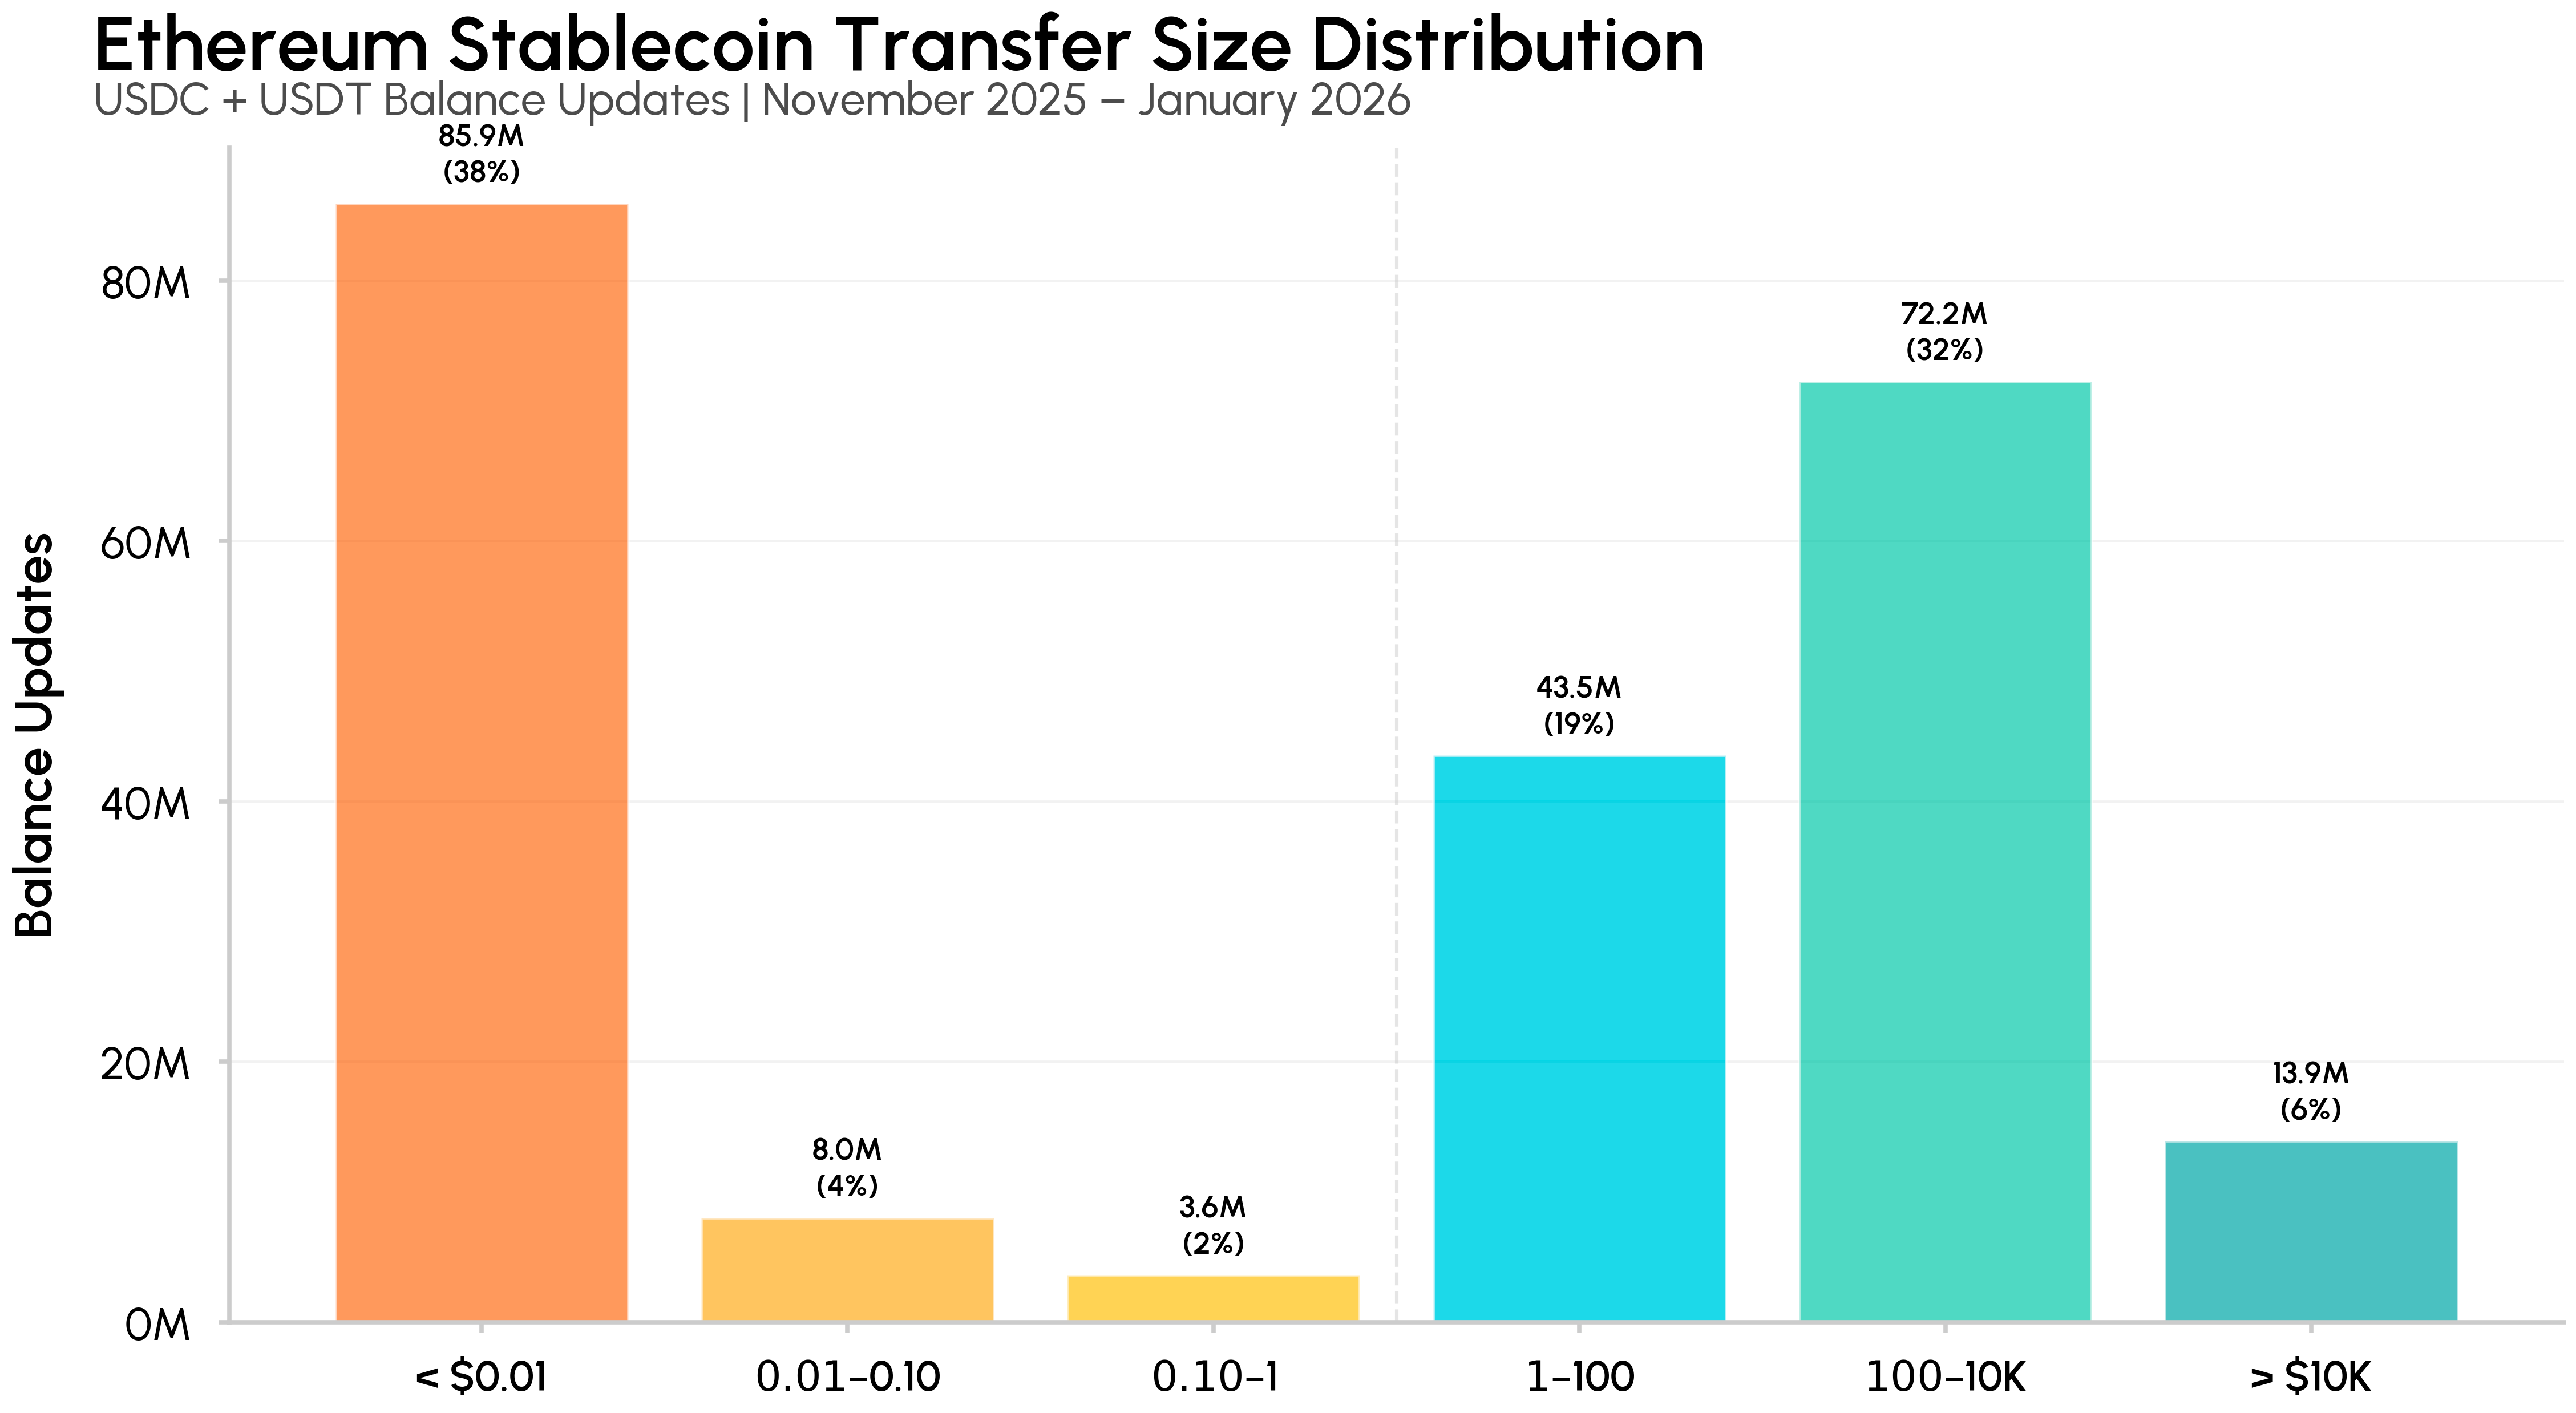
To understand the scale of address poisoning, we analyzed over 227 million balance updates for USDC and USDT on Ethereum from November 2025 through January 2026 using Coin Metrics’ ATLAS. Of the balance updates analyzed, 97.6 million (43%) involved transfers of less than $1. Additionally 85.9 million (38%) were under a single penny, amounts with insignificant economic purpose other than wallet seeding.
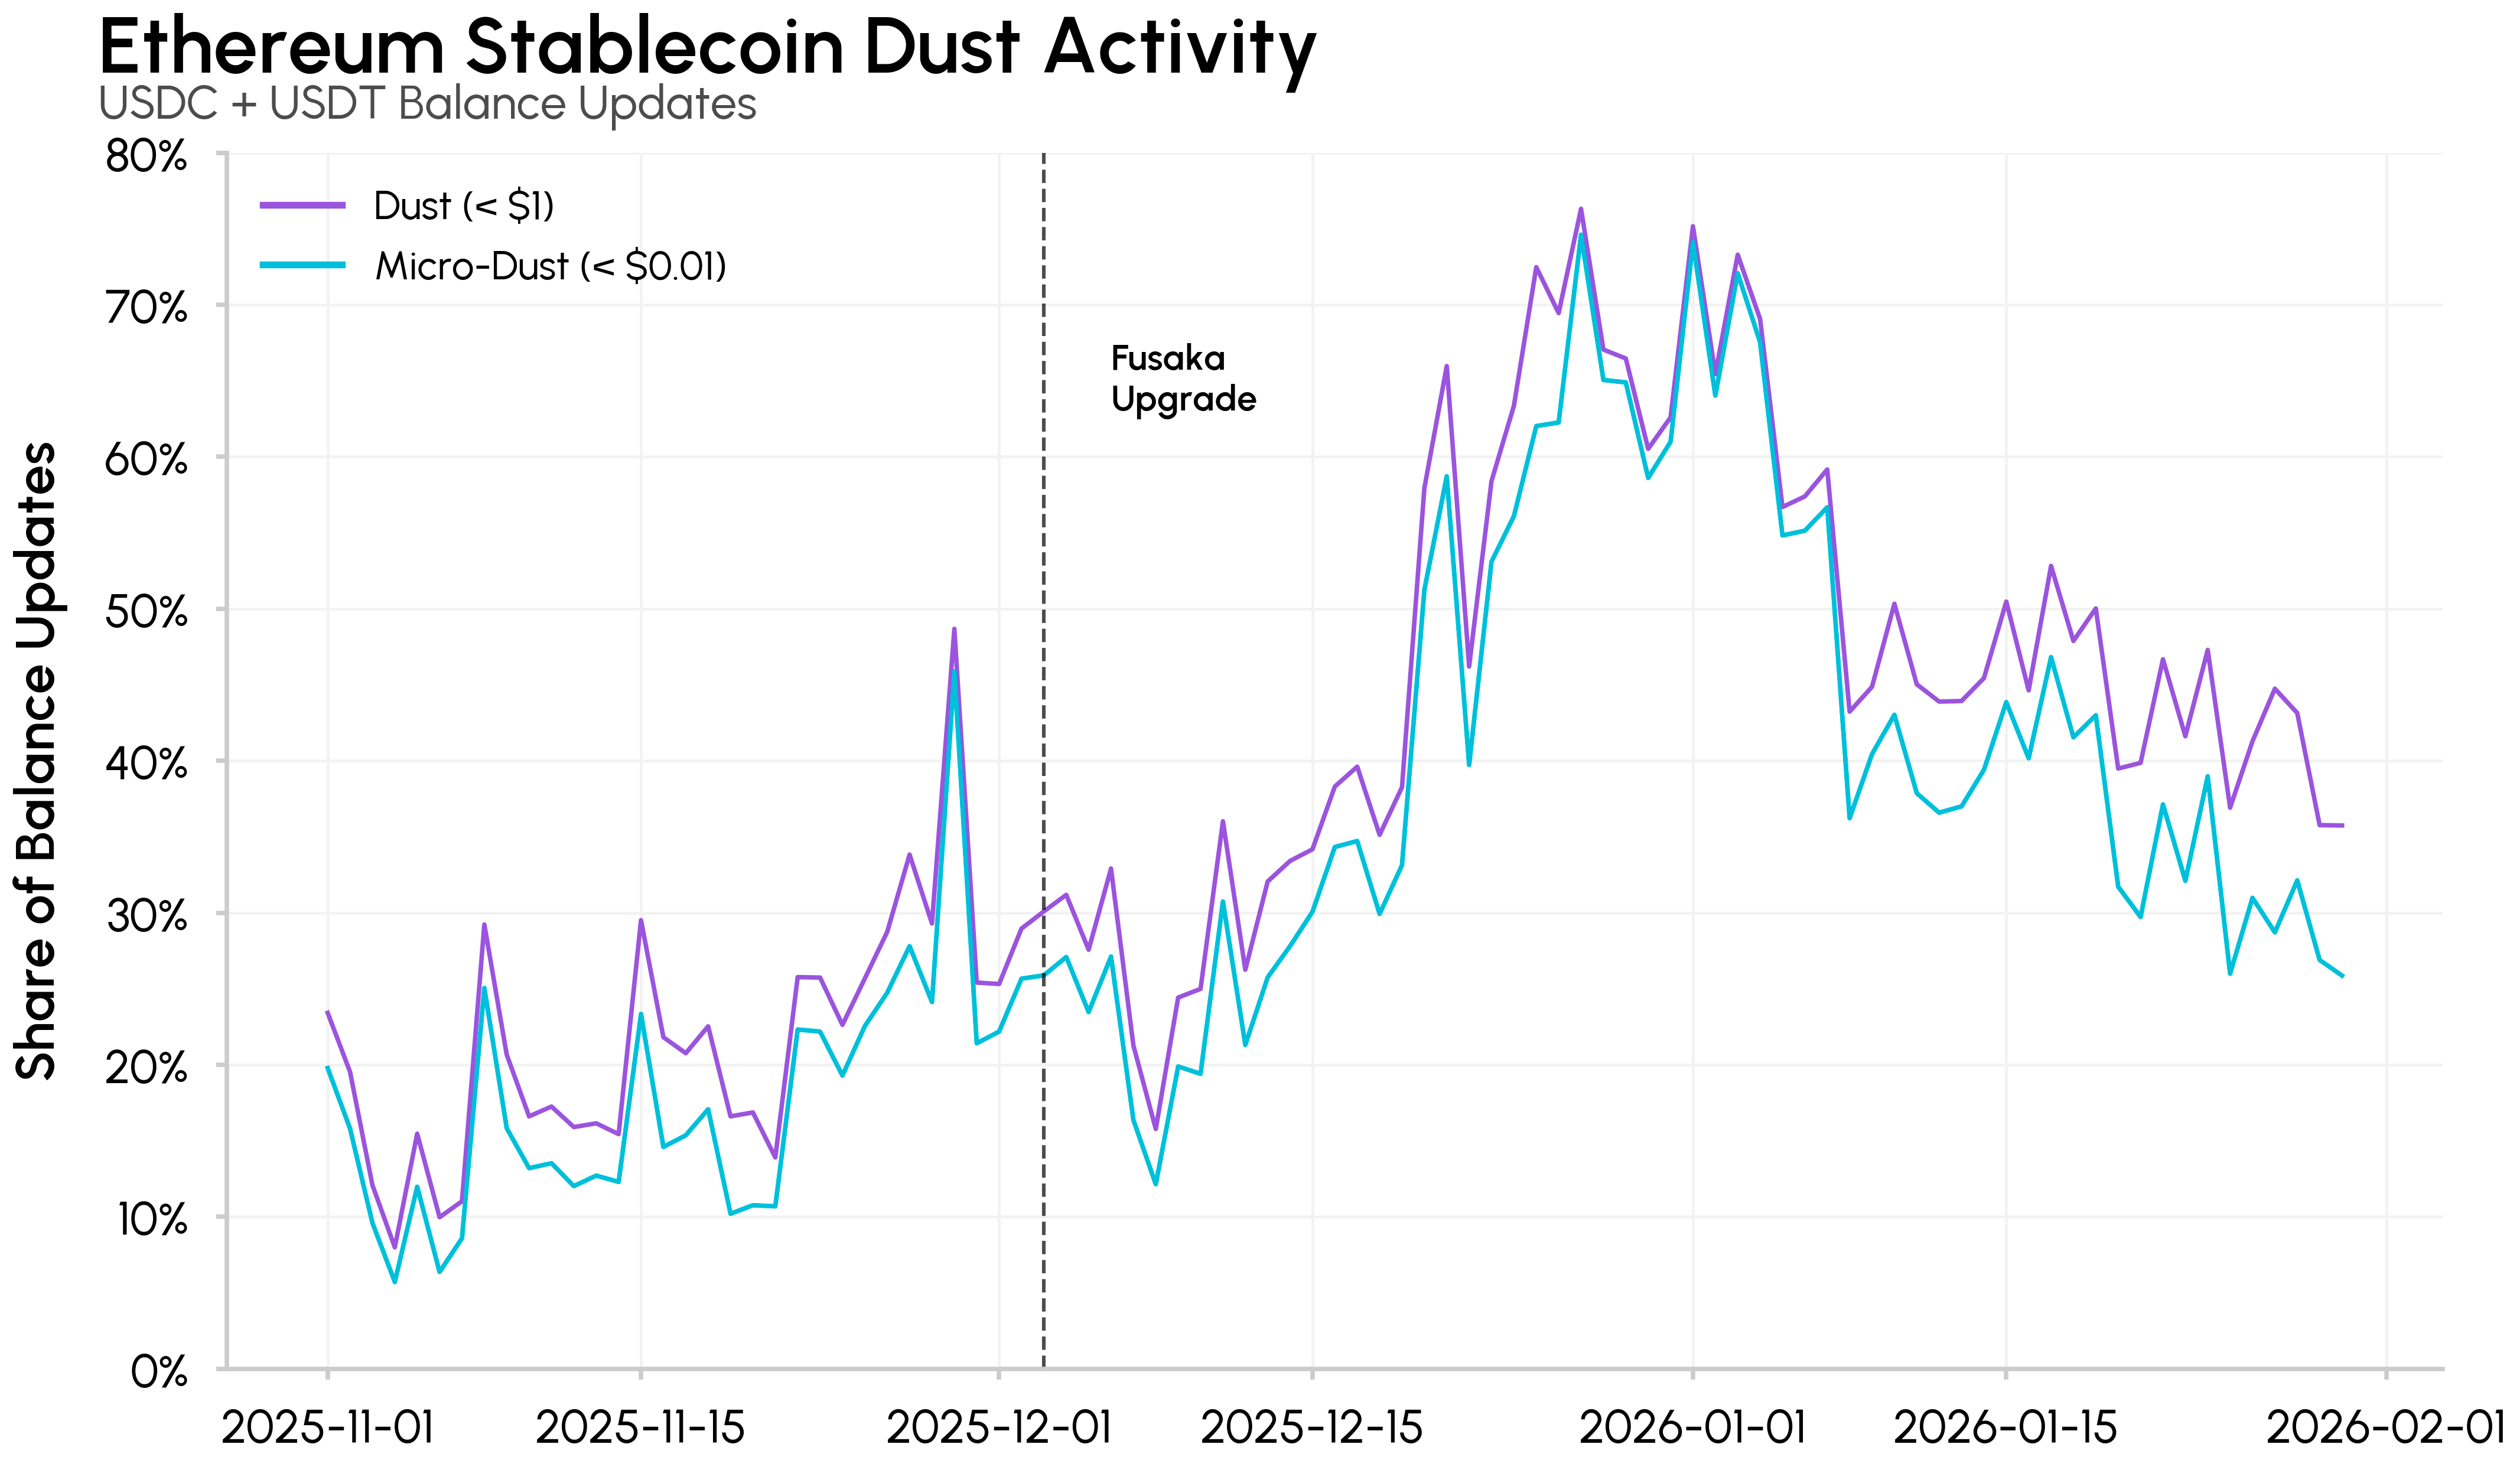
The remaining 57% of balance updates involved transfers above $1, suggesting the majority of stablecoin activity remains organic. However, as seen below, the share of dust activity increased sharply following the Fusaka upgrade, rising from ~20% to over 70% at its peak.
Identifying Dust Addresses
The dust activity is highly concentrated among a small number of addresses. The top 10 senders alone account for over 8.5 million dust transfers, consistent with mass distribution of dust rather than organic activity.
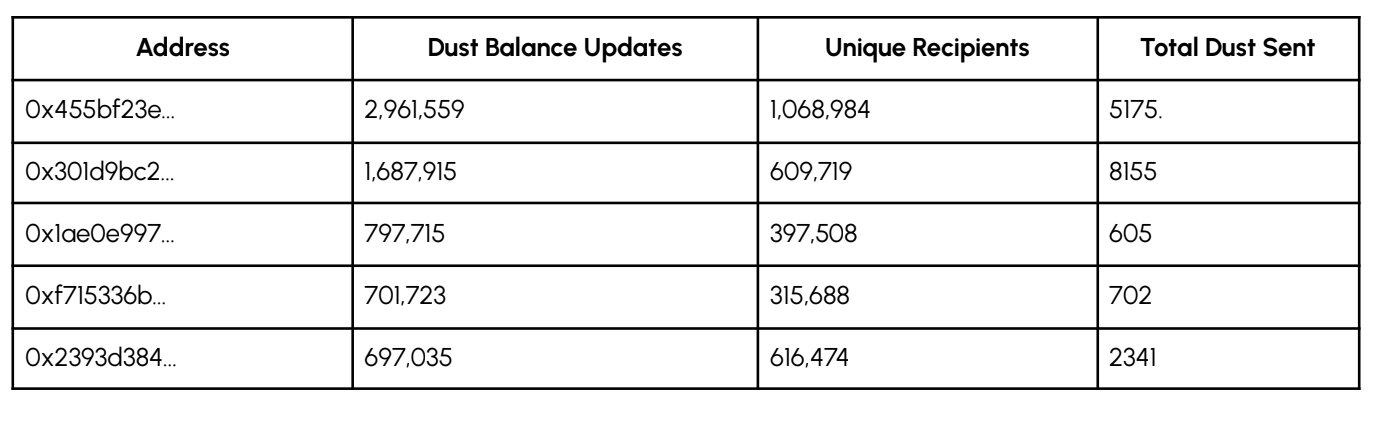
The top attacker address (0x455bf23ea7575a537b6374953fa71b5f3653272c) sent nearly 3 million dust transfers to over 1 million unique addresses, totaling just ~$5,175 in stablecoin value, fractions of a cent per victim. These tiny amounts have no economic purpose as they exist solely to appear in victims’ transaction histories. The true cost to attackers is Ethereum gas, which dropped following Fusaka, making mass dust distribution economically viable for the first time.
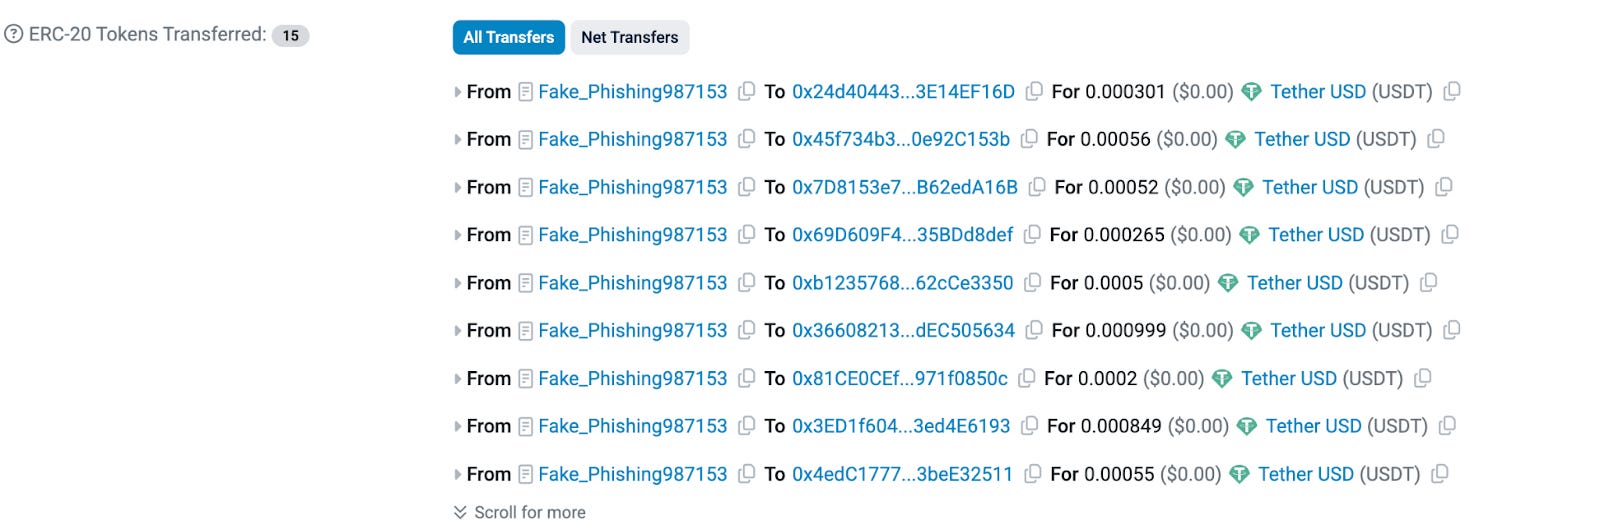
Attackers maximize efficiency by batching dust transfers through automated smart contracts, where a single transaction can poison dozens of wallets simultaneously. For example, transaction 0x582f316c... shown above, sent dust to 12 separate recipients in one operation, each receiving fractions of a cent. This spray pattern allows attackers to reach millions of potential victims while minimizing gas costs. As a result, across identified accounts, dust was sent to 7.9 million unique addresses over the period.
Estimating The Scale of Dust Activity on Ethereum
Combining the stablecoin analysis with Ethereum network data helps contextualize the scale of activity growth. Pre-Fusaka, stablecoin dust represented roughly 3-5% of Ethereum transactions and 15-20% of active addresses. Post-Fusaka, these figures jumped to 10-15% of transactions and 25-35% of active addresses on a typical day, a 2-3x increase.
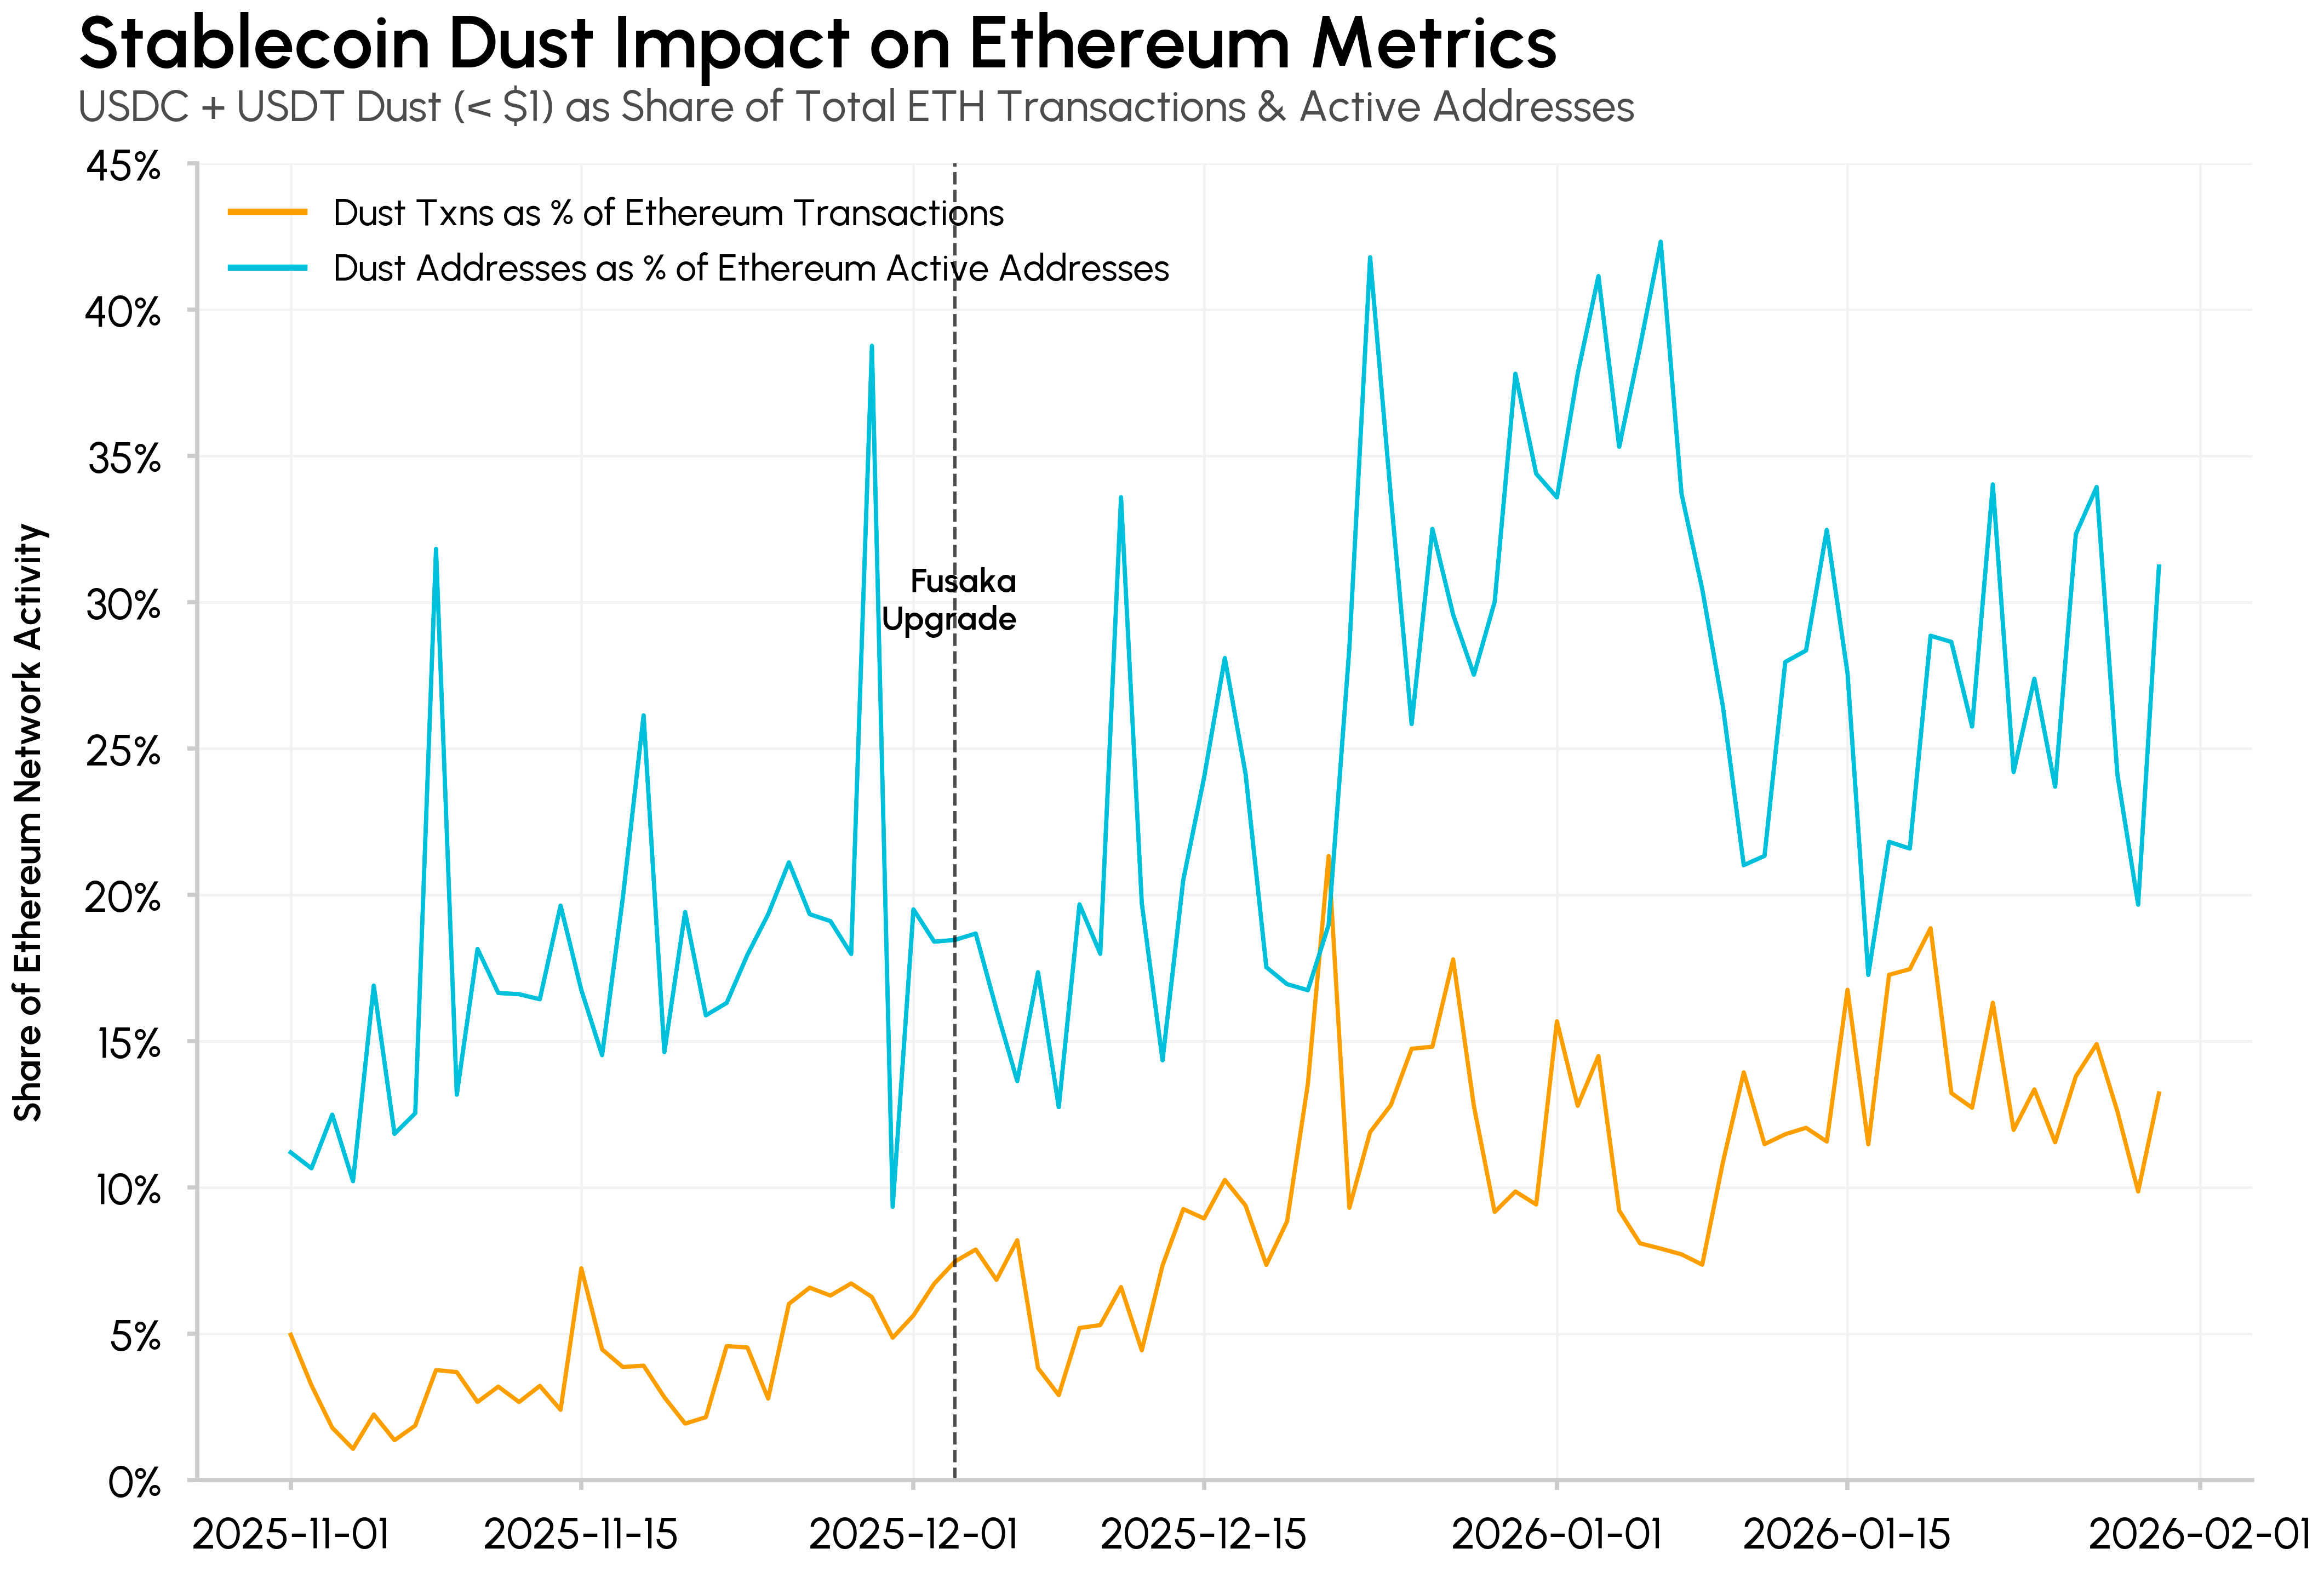
This means approximately 250K-350K addresses per day are now involved in stablecoin dust activity. The majority of post-Fusaka growth reflects genuine usage, though dust activity is a factor worth noting when interpreting headline metrics.
Conclusion
The post-Fusaka surge in Ethereum activity is real, but the findings reveal a portion tied to address poisoning rather than purely organic growth. This presents a nuanced tradeoff, where lower fees can reduce barriers to entry, not only for users but also for dust attacks.
Common habits like copying addresses from transaction history or verifying only the first and last few characters carry more risk when mass dust distribution is economically viable. Wallet interfaces that display full addresses, flag suspicious low-value transfers, and de-emphasize dust could help reduce user exposure to these attacks. While dust transfers are real onchain activity, they don’t represent genuine economic usage, highlighting the value of adjusted metrics that filter for economic relevance.
While this analysis focused on USDC and USDT on Ethereum, the dynamic may extend to other tokens and low-fee chains, making dust activity an increasingly relevant consideration for security practices and onchain analysis going forward.
Disclaimer: The information herein is provided for informational purposes only. Talos Trading, LLC and its affiliates (“Talos”) does not give any representations or warranties in relation to the accuracy, validity, or completeness of the information of this material, including without limitation the factual information obtained from publicly available sources considered by Talos to be reliable at the time. Talos accepts no liability for any consequences of using the information contained in this material. Any opinions or estimates expressed herein reflect a judgment made by the author(s) as of the date of publication and are subject to change without notice. Neither this material nor any copy thereof may be taken, reproduced, or redistributed, directly or indirectly, without Talos’s prior written permission. Any views or opinions expressed are those of the authors and do not necessarily reflect the views of Talos. This communication does not constitute an offer to buy or sell, or a promotion or recommendation of, any digital asset, security, derivative, commodity, financial instrument, or product or trading strategy. This document and information are not intended to constitute investment advice or a recommendation to make (or refrain from making) any kind of investment decision and may not be relied on as such.
Subscribe
If you’d like to get State of the Network in your inbox, please subscribe below.
Latest insights and research


Request a demo
Find out how Talos can simplify the way you interact with the digital asset markets.