
Understanding Market Impact in Crypto Trading: The Talos Model for Estimating Execution Costs
Talos introduces an empirically calibrated market impact model that helps institutional crypto traders estimate execution costs, evaluate strategies, and reduce unexpected slippage.
Understanding Market Impact in Crypto Trading: The Talos Model for Estimating Execution Costs

Introduction
Talos introduces an empirically calibrated market impact model that helps institutional crypto traders estimate execution costs, evaluate strategies, and reduce unexpected slippage.
Introduction: The $3 Trillion Blind Spot
Institutional cryptocurrency traders managing billions of dollars face a critical blind spot: they can’t accurately predict execution costs before trading. While equity traders have had sophisticated market impact models for over 25 years, enabling pre-trade scenario analysis, execution strategy optimization and risk-controlled position sizing, crypto traders are essentially flying blind. This gap costs institutional investors millions in unnecessary slippage, especially as they scale their digital asset allocations.
According to a recent survey, 86% of institutional investors are exposed to digital assets or plan to make allocations in 2025, with 59% planning to allocate over 5% of their assets under management to cryptocurrencies.1 Yet despite this massive capital flow, the literature on cryptocurrency market impact modeling is remarkably thin. To the best of our knowledge, no quantitative model has been developed or empirically calibrated to estimate expected slippage from order arrival for given trade sizes and horizons in digital asset markets.
This isn’t just an academic exercise, it’s a real operational problem. When you’re executing a $10 million BTC order over 4 hours, you need to know: What will this cost? Should I trade faster or slower? How do I optimize my execution strategy? Without a calibrated market impact model, these questions remain unanswered, leading to suboptimal execution and unnecessary costs.
At Talos, we’ve spent years building the infrastructure and datasets needed to solve this problem. Today, we’re excited to introduce the first empirically calibrated market impact model for cryptocurrency trading; the Talos Market Impact (TMI) model. This model decomposes execution costs into three actionable components: spread cost, physical impact, and time risk. Full methodological details and statistical validation will be published in an academic journal in the future, but here’s what practitioners need to know now.
1 Why existing models fall short for crypto
The academic literature on market impact has been dominated by a fundamental debate: does order size matter, or is it all about duration? This question has split the field into two camps, as illustrated in Figure 1.
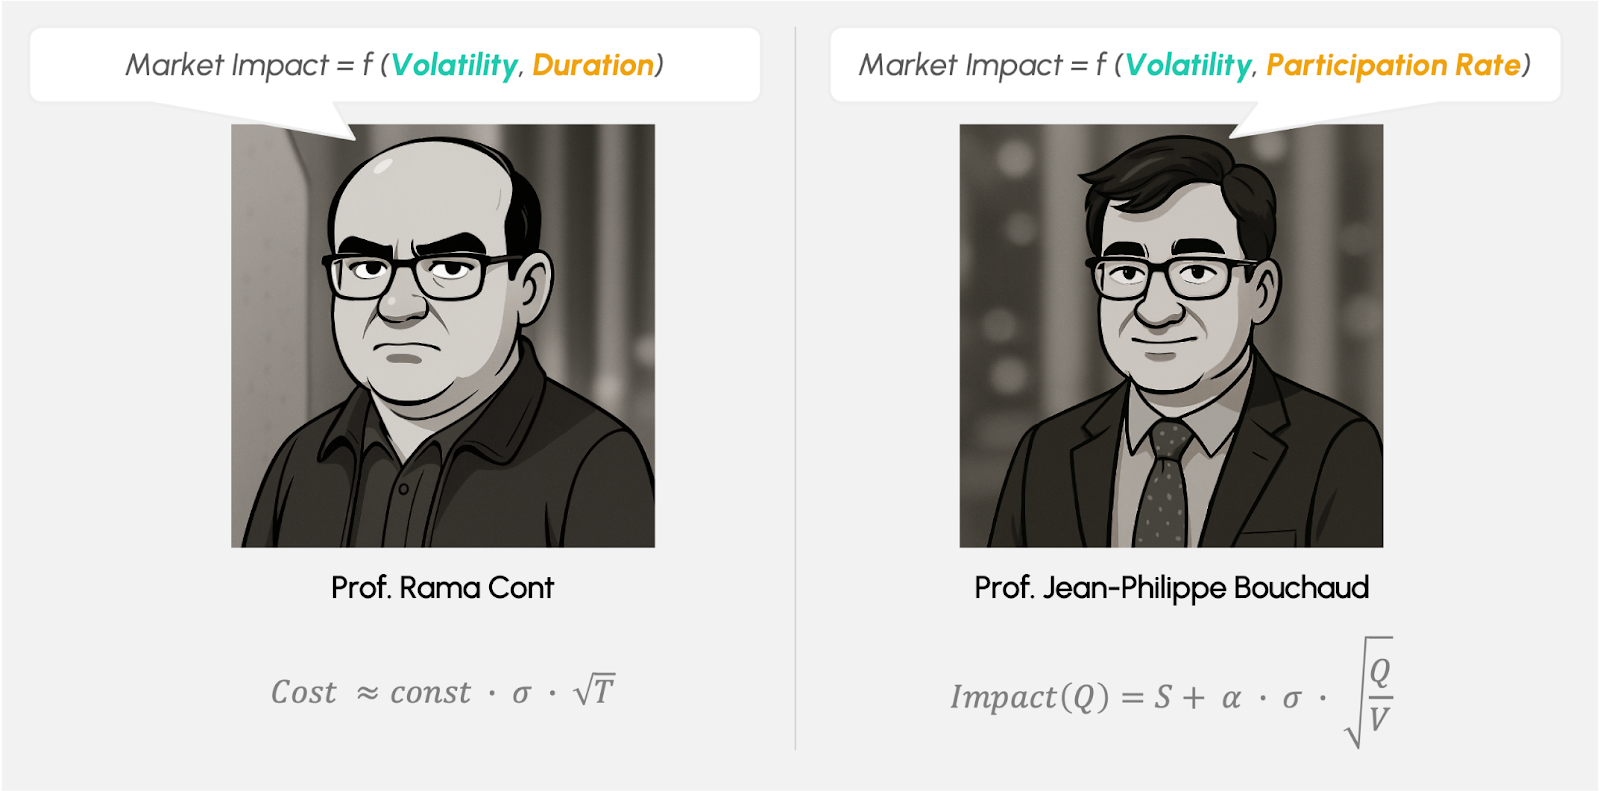
On one side, Cont and colleagues argue that market impact is primarily driven by volatility and the square root of duration. Their model suggests that the primary driver is price uncertainty over the execution horizon, rather than the size of the order relative to market volume. This approach has theoretical elegance, but it assumes that trade size correlates with order duration, an assumption that breaks down in crypto institutional trading.
On the other side, Bouchaud and colleagues maintain that order size absolutely matters, specifically when expressed as participation rate (order size normalized by market volume). Their square-root law has been validated across various asset classes, showing that larger orders relative to market volume create more impact. However, this model struggles at extreme participation rates, both very low (under 0.5%) and very high (over 20%), where the square-root relationship breaks down.
More critically, neither model incorporates a separate time-risk component. For institutional crypto traders executing orders over long horizons at low participation rates, this is a fatal flaw. Consider a scenario where you want to buy $5 million of ETH using a VWAP algorithm over 5 hours, which yields a 0.2% participation rate. It is safe to assume that over such a horizon, at such a low participation rate, the price impact as a function of the physical interaction with the orderbooks would be small but not negligible, while the 5-hour time-risk of missing the arrival price would be significant. Having a model that captures both components would be essential for optimal realistic estimation of execution costs.
The reality is that crypto markets need both components, plus something more. We need a model that:
- Captures physical impact from orderbook liquidity consumption (size matters)
- Captures time risk from volatility exposure over the execution horizon (duration matters)
- Handles edge cases where participation rates are very low or very high
- Decomposes costs so traders can incorporate their own alpha views
This is exactly what the TMI model delivers.
2 The dataset: Why this is possible now
Building a robust market impact model requires something that’s been nearly impossible to obtain in crypto markets: data on the complete lifecycle of institutional orders. You need to know not just what was traded, but the original instruction (parent order), how it was executed across multiple venues (child orders), and the full timeline from arrival to completion.
Most crypto exchanges don’t have this data. Academic researchers certainly don’t. But at Talos, we’ve built the infrastructure that captures exactly this, making us uniquely positioned to solve the market impact problem. Luckily, we also have the TradFi know-how to build a model that is both theoretically sound and empirically validated.
Our dataset, the first of its kind in digital asset markets, encompasses:
- 50,000+ parent orders and 50 million+ child orders across the top 60 spot and perpetual contracts
- Full order lifecycle from initial instruction through multi-venue execution
- Diverse institutional clientele including asset managers, hedge funds, market makers, and systematic traders—ensuring the model captures real-world trading patterns, not just one type of flow
- 50+ liquidity venues including both centralized exchanges and private liquidity providers
- June 2024 to July 2025 coverage period, with comprehensive tick-by-tick market data reconstruction (you probably already know Talos recently acquired CoinMetrics!)
What makes this dataset uniquely valuable isn’t just its size, but the diversity of trading strategies and market views it captures. Our clients trade everything from delta-neutral mid-frequency systematic trading to directional alpha strategies, to multi-day execution horizons, across the full spectrum of institutional trading.
3 The model: Three components of execution cost
The Talos Market Impact (TMI) model decomposes execution costs into three distinct components, each capturing a different aspect of the trading process:
3.1 Spread cost: The immediate price of liquidity
When you cross the bid-ask spread, you pay an immediate cost. This is the most direct form of market impact, the price you pay for immediate execution. The spread cost component is straightforward:

where S is the bid-ask spread and c1 is a coefficient calibrated from historical data. This cost is independent of order size and duration; it simply captures the fees-inclusive probability of crossing the spread.
3.2 Physical impact: When size matters
The physical impact component captures how consuming orderbook liquidity affects price. This follows the square-root law, adjusted with a sigmoid function to handle edge cases:
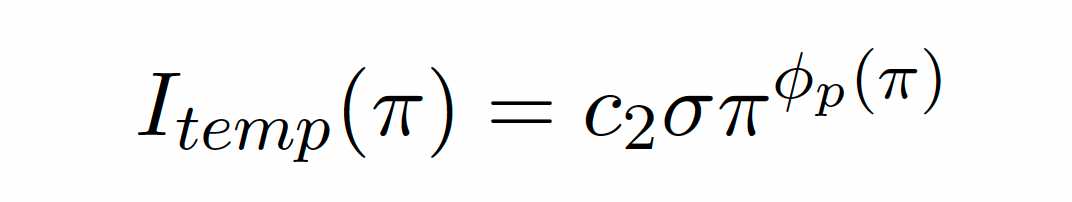
where π = Q/VT is the participation rate (order size Q relative to market volume VT over the execution horizon), σ is intraday volatility, and ϕp(π) is a sigmoid function that adjusts the exponent based on participation rate.
The key insight: larger orders relative to market volume create more impact, but the relationship isn’t linear. The square-root law (ϕp = 0.5) works well in the middle range, but at very low participation rates (under 0.5%), the model needs adjustment to capture volatility-driven dynamics. At very high participation rates, the relationship also changes. The sigmoid function smoothly transitions between these regimes, as shown in Section 4 below.
3.3 Time risk: The risk of missing the arrival price
The time-risk component captures the risk of missing the arrival price over the execution horizon. This is particularly important in crypto markets, which trade 24/7 with no overnight risk adjustment periods.
3.4 The complete model
Combining these three components, the TMI model provides:
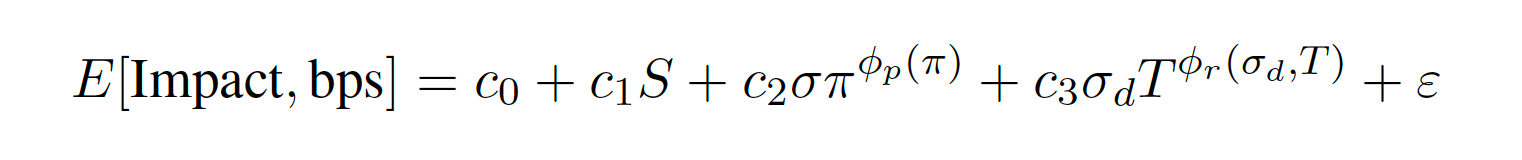
This decomposition is powerful because it allows traders to:
- Separate physical impact from time risk – enabling informed decisions about execution speed
- Incorporate alpha views – if you expect price reversion, you can adjust the time-risk component accordingly
- Optimize execution strategies – understanding which component dominates helps inform the choice between faster (higher physical impact) or slower (higher time risk) execution
4 Results: Validated on real trading data
The TMI model has been calibrated and validated against our proprietary dataset of 50,000+ parent orders. The results demonstrate strong predictive accuracy across the full spectrum of institutional trading scenarios.
Figure 2 presents validation results across different slippage ranges, showing how the model performs at various impact levels.
The validation reveals several key insights:
- High accuracy for typical trades: The majority of samples (over 26%) fall in the 0-5 bps actual slippage range, where the absolute prediction error is minimal, demonstrating the model’s accuracy for typical institutional trading scenarios.
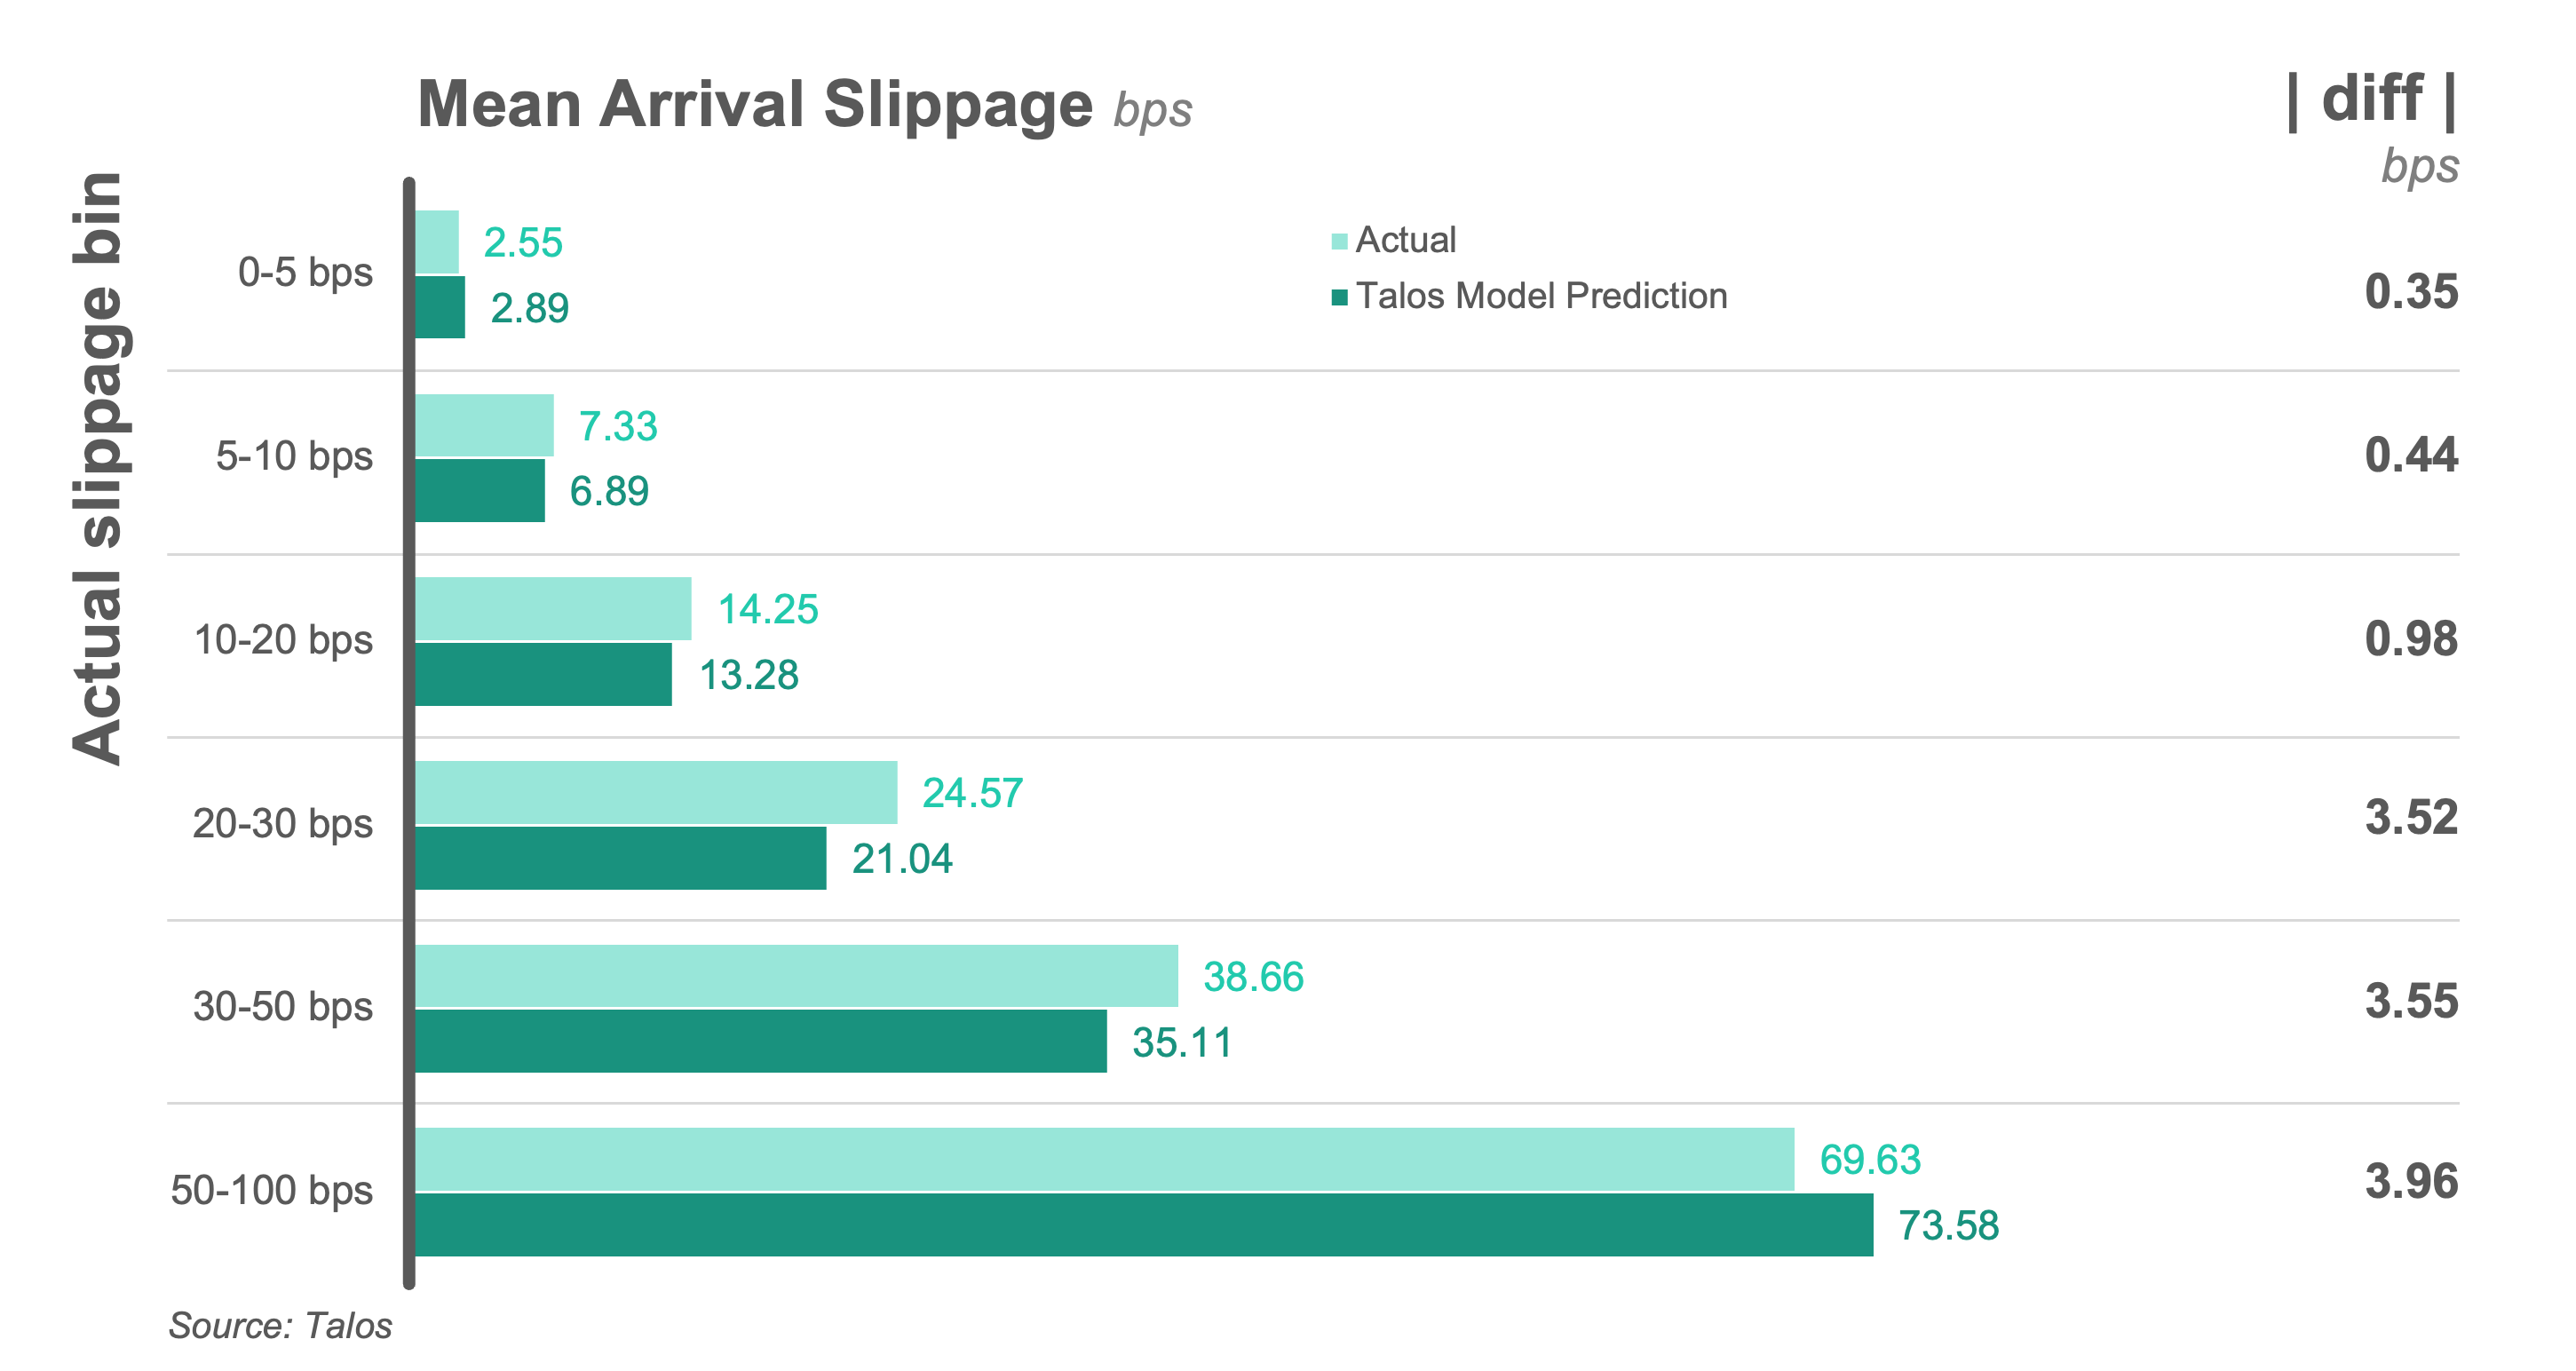
- Robust across impact levels: As slippage increases, prediction errors grow slightly, but remain well within acceptable bounds for practical use.
- Critical edge case handling: Most importantly, the model successfully captures the low participation rate regime (under 0.5%) where other models systematically underestimate impact. This is where the sigmoid adjustment proves essential.
Perhaps the most compelling validation comes from comparing the square-root law specification (fixed exponents) against the sigmoid-adjusted version. Figure 3 shows this comparison, revealing significant underestimation by the square-root law at very low participation rates.

The left panel shows the square-root law consistently underestimating actual slippage by approx-imately 4 basis points in the critical 0-0.5% participation rate range, exactly where many institutional traders operate. The right panel demonstrates how the sigmoid-adjusted model closely tracks actual slippage across the entire spectrum, with particularly strong alignment in the low-participation-rate regime.
5 Real-world application: Pre-trade scenario analysis
The real value of the TMI model isn’t just in its statistical validation, it’s in enabling practical decision-making before you commit capital. Let me walk through a concrete example.
Scenario: You want to buy $10 million of BTC over a 4-hour execution horizon using a VWAP algorithm. Current market conditions: 0.9 bps bid-ask spread, 2.8% daily volatility, expected market volume of $500 million over 4 hours.
The Question: What will this cost, and how should I execute? The TMI model decomposes the expected impact:
- Spread cost: Immediate cost of crossing the spread
- Physical impact: Based on your participation rate (2% in this case)
- Time risk: Based on volatility and 4-hour duration With this decomposition, you can now:
- Compare execution strategies: What if I trade faster (2 hours)? What if I trade slower (8 hours)? The model shows the tradeoff between physical impact and time risk. How does that compare to Percent of Volume (POV) execution at 1.5% participation rate?
- Incorporate alpha views: If you expect BTC to trend down during execution, you can "discount" the time-risk component estimation downward.
- Optimize venue selection: Different venues have different spreads and liquidity, the model helps quantify the cost difference.
- Set realistic expectations: Before you trade, you know what slippage to expect, enabling better risk management and performance attribution.
At Talos, we’re building this directly into our execution infrastructure. Traders will be able to run pre-trade scenario analysis, comparing different execution strategies and seeing the expected cost breakdown before committing to a trade.

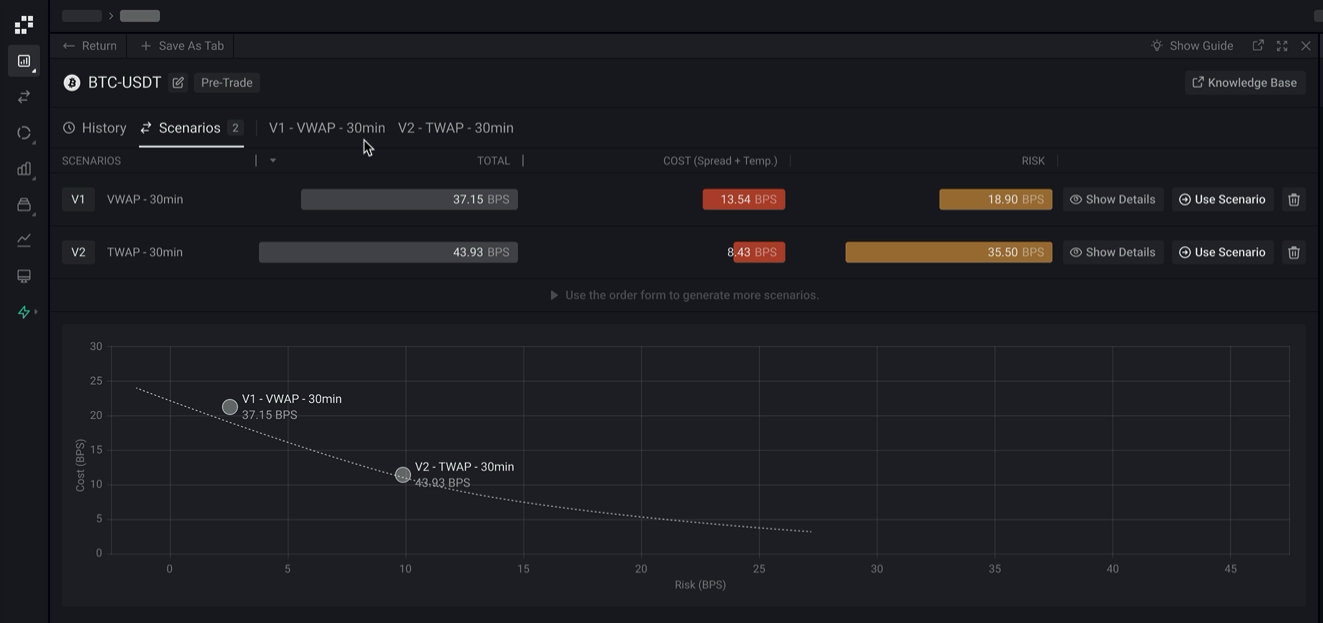
The Talos Market Impact Model in action:
This capability, previously available predominantly in equity markets, will be accessible to institutional crypto traders through the Talos platform.
6 Conclusion: The first step toward optimal execution
To the best of our knowledge, the TMI model represents the first empirically calibrated market impact model for cryptocurrency trading that conforms to institutional execution principles. It’s not just an academic exercise, it’s a practical tool that’s already powering execution decisions for Talos’s institutional clients.
The model’s key innovations:
- Three-component decomposition enabling actionable insights
- Sigmoid adjustment handling edge cases where simple square-root laws fail
- Explicit time-risk component critical for long-duration, low-participation-rate orders
- Empirical calibration on real institutional trading data, not theoretical assumptions
But this is just the beginning. The model opens the door to:
- Optimal execution schedule generation (extending Almgren-Chriss frameworks to crypto)
- Real-time execution monitoring and adjustment
- Portfolio-level impact optimization
- Cross-asset execution cost analysis
Full methodological details, statistical validation, and academic rigor will be published in a peer-reviewed journal in the future. For now, institutional traders can access these capabilities through Talos’s execution services, bringing the sophistication of equity market execution to digital asset trading.
The $3 trillion crypto market is maturing. It’s time that the execution infrastructure caught up.
At Talos, we believe you should focus on what to trade while we help you with the how.
1. Source: EY Parthenon and Coinbase: 2025 Institutional Investor Digital Assets Survey.
Related Links:
- Research paper: An Empirical Model of Market Impact in Cryptocurrency Trading →
- VWAP or TWAP for Crypto Execution? A Market Impact Perspective →
- Execution Alphas in Crypto Markets: Predicting Volume, Volatility, and Spreads to Reduce Slippage →
About the Author

Eliad Hoch is the Head of Quantitative Execution Services at Talos, the premier provider of institutional digital asset technology and data for trading and portfolio management. Based in London, he oversees the front-office lifecycle of algorithmic trading, guiding clients through slippage minimization tactics, trade scenario analysis and TCA, while overseeing the quantitative trading strategies offered by the firm. Prior to Talos, Eliad spent 2 years as the Founder of GONLabs, a systematic crypto trading hedge fund, focused on quant and machine learning-driven crypto strategies. Before that, he spent 12 years in the equities, futures and FX markets at Bank Of America Merrill Lynch and Goldman Sachs in portfolio algorithmic execution, quant modeling, central risk trading and systematic internalization market making. Eliad has co-authored several papers on systematic trading strategies and market impact, and published a 2024 paper exploring tokenomics design and DeFi value propositions. He is a guest lecturer at various UK universities on algo trading and quant modeling. Eliad holds a masters in computational finance and artificial intelligence from the University of Southampton, where he received first class honors and the top independent research award.
Disclaimer: Talos Global, Inc., together with its affiliates (collectively, “Talos”), is not an investment advisor or broker/dealer. No Talos product or service constitutes an offer to buy or sell, or a promotion or recommendation of, any digital asset, security, derivative, commodity, financial instrument or product or trading strategy. Further, No Talos product or service is intended to constitute investment advice or a recommendation to make (or refrain from making) any kind of investment decision and may not be relied on as such. Talos offers data and software as a service products that provide connectivity tools for institutional clients.
Latest insights and research
.jpg)


Request a demo
Find out how Talos can simplify the way you interact with the digital asset markets.