

50 Shades of Gray: Explore Pricing Gaps in Midterm Prediction Markets
State of the Network #387
50 Shades of Gray: Explore Pricing Gaps in Midterm Prediction Markets

Introduction
State of the Network #387
Key Takeaways:
- Kalshi prices the same question, “Will Democrats control the Senate?”, through four contract families. Since August, their implied probabilities have differed by 3.3 percentage points on average, and by as much as 9.7 points. On Oct 25, they ranged from 62.5% to 65.3%.
- A hypothetical nine-leg package (buy Democratic Senate control, sell every Democratic seat count of 51 or more) pays $8 under either outcome if both contract families resolve on the same basis, and was priced below $8 on 19 of 51 days at end-of-day quotes, creating a potential arbitrage opportunity (peak 8.1¢ per $8 before fees on Oct 24).
- Execution assumptions drive the result. After estimated fees, the modeled edge stayed positive on 7 days (up to +4.7¢) when the main leg was assumed to fill passively, but on only 2 days when every leg crossed the spread.
- Liquidity is lopsided. The Democratic control contract traded $3.3M since August, while some seat-count contracts priced into the package traded as little as $2K.
- The Senate is one example. With more than 880,000 live Kalshi contracts (1) captured by Talos CM prediction market data, the same fragmented structure can create similar pricing gaps across events and venues. Capturing them takes systematic identification and careful execution.
Introduction
With the midterms a week away, more than $1.4 billion has traded on 2026 midterm contracts across Kalshi and Polymarket (2). Most coverage reports a single headline number: Kalshi currently gives Democrats about a 63% chance of winning the Senate.
Thanks for reading Coin Metrics State of the Network! Subscribe for free to receive new posts and support my work.
That number is only one of several. Kalshi lists 38 separate contracts tied to Senate control, spread across five events. Each contract has its own order book and its own traders. In this issue, we compare the probabilities these contracts imply, look at when the differences add up to a modeled arbitrage edge, and examine the market structure that keeps those differences open.
One Question, Four Answers
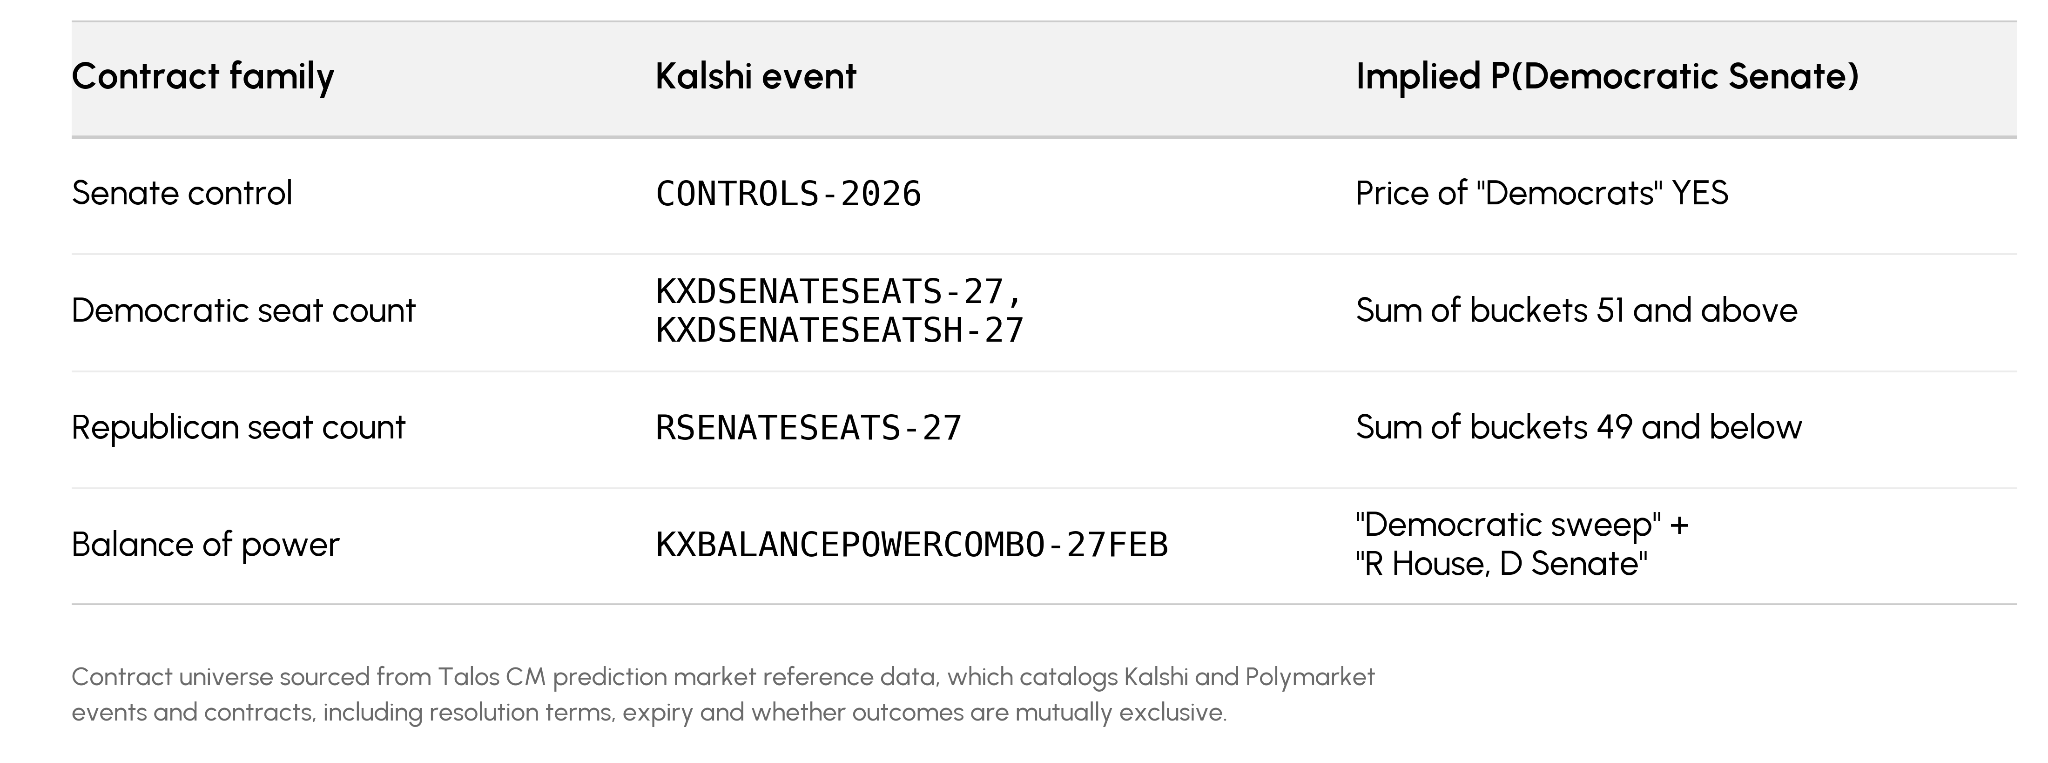
Senate control can be expressed in four ways on Kalshi:
Source: Kalshi market data, Talos analysis
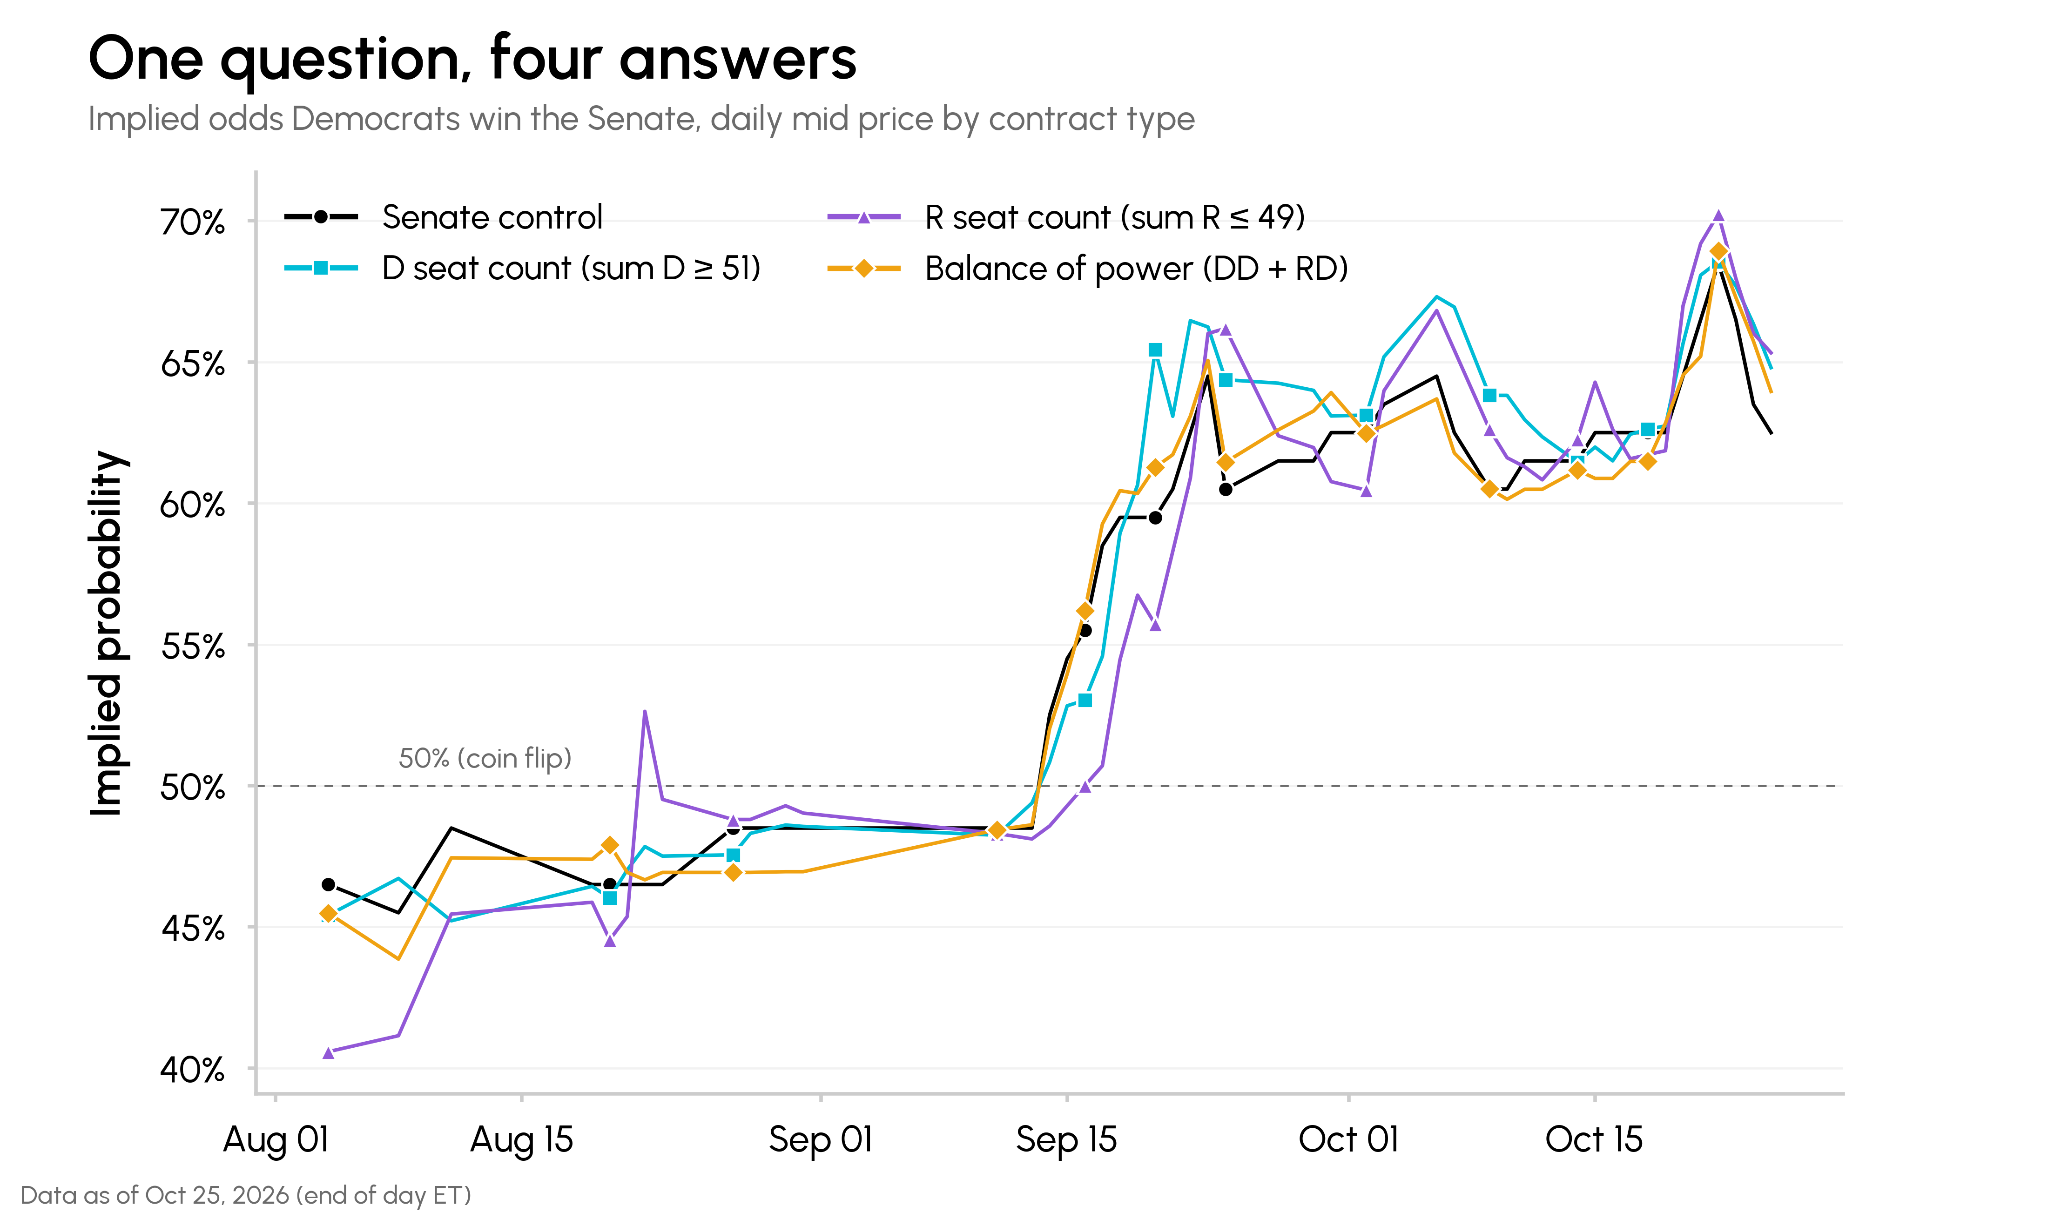
If every contract were priced consistently, all four lines below would overlap.
Source: Kalshi market data, Talos analysis
They follow the same trend, as Democratic odds climbed from about 46% in early August to the low 60s by October. But they rarely agree exactly. The Democratic seat-count ladder implied higher Democratic odds than the headline control contract on two-thirds of days. On Sep 20, the four answers ranged from 55.7% (Republican seat count) to 65.4% (Democratic seat count).
Source: Kalshi market data, Talos analysis
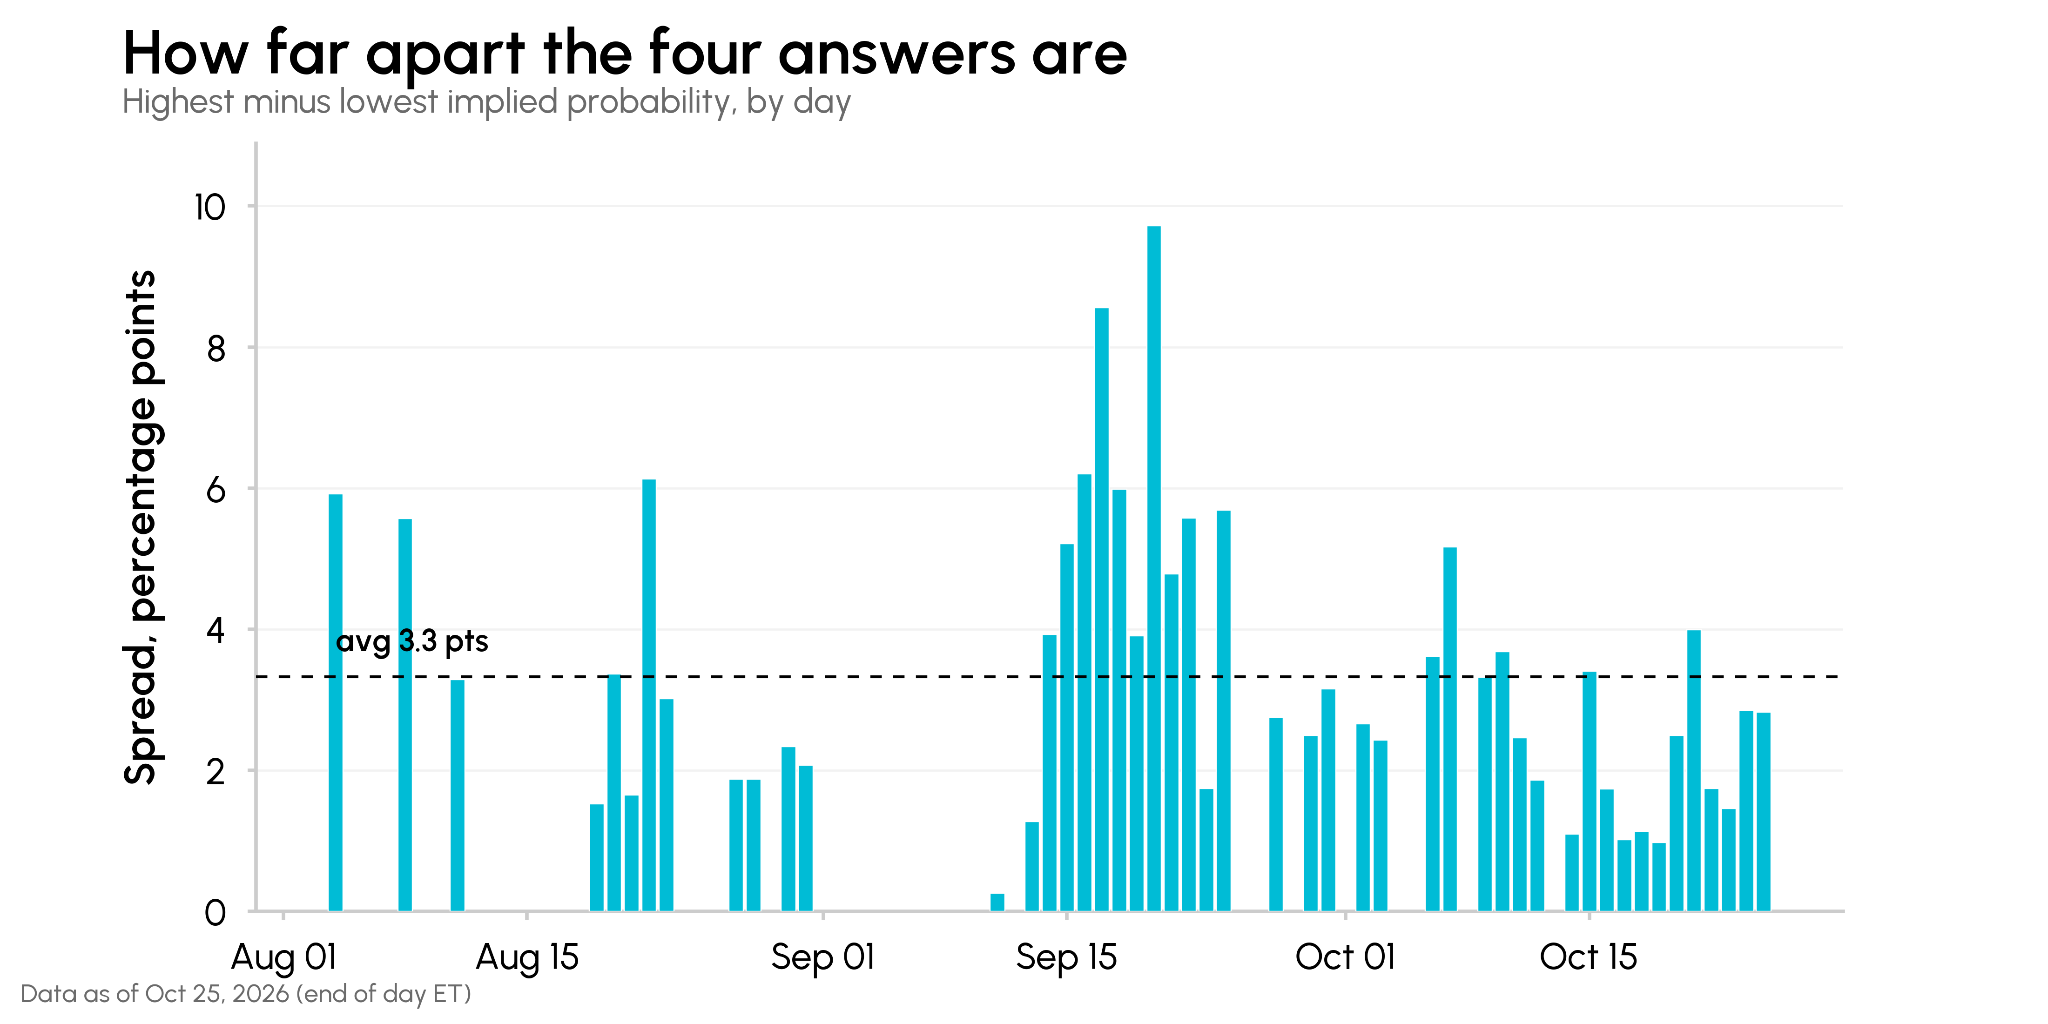
The gap between the highest and lowest implied probability averaged 3.3 points. It was widest in September (4.5 points on average, against 3.2 in August) and averaged 2.5 points in October, over the same period that trading volume grew. It has not closed: it still reached 4.0 points on Oct 21.
Piecing Together the Package
When two contracts disagree about the same outcome, buying the cheaper side of each can, in principle, secure the difference. The simplest version here combines nine legs:
- Buy YES on Democrats winning Senate control. It pays $1 if they win.
- Buy NO on each Democratic seat count from 51 up (51, 52, 53 … 57, above 57). Each pays $1 if Democrats do not land on that exact number.

Provided both contract families resolve on the same basis, the payout is $8 under either outcome, so the package carries a modeled edge whenever it costs less than $8.
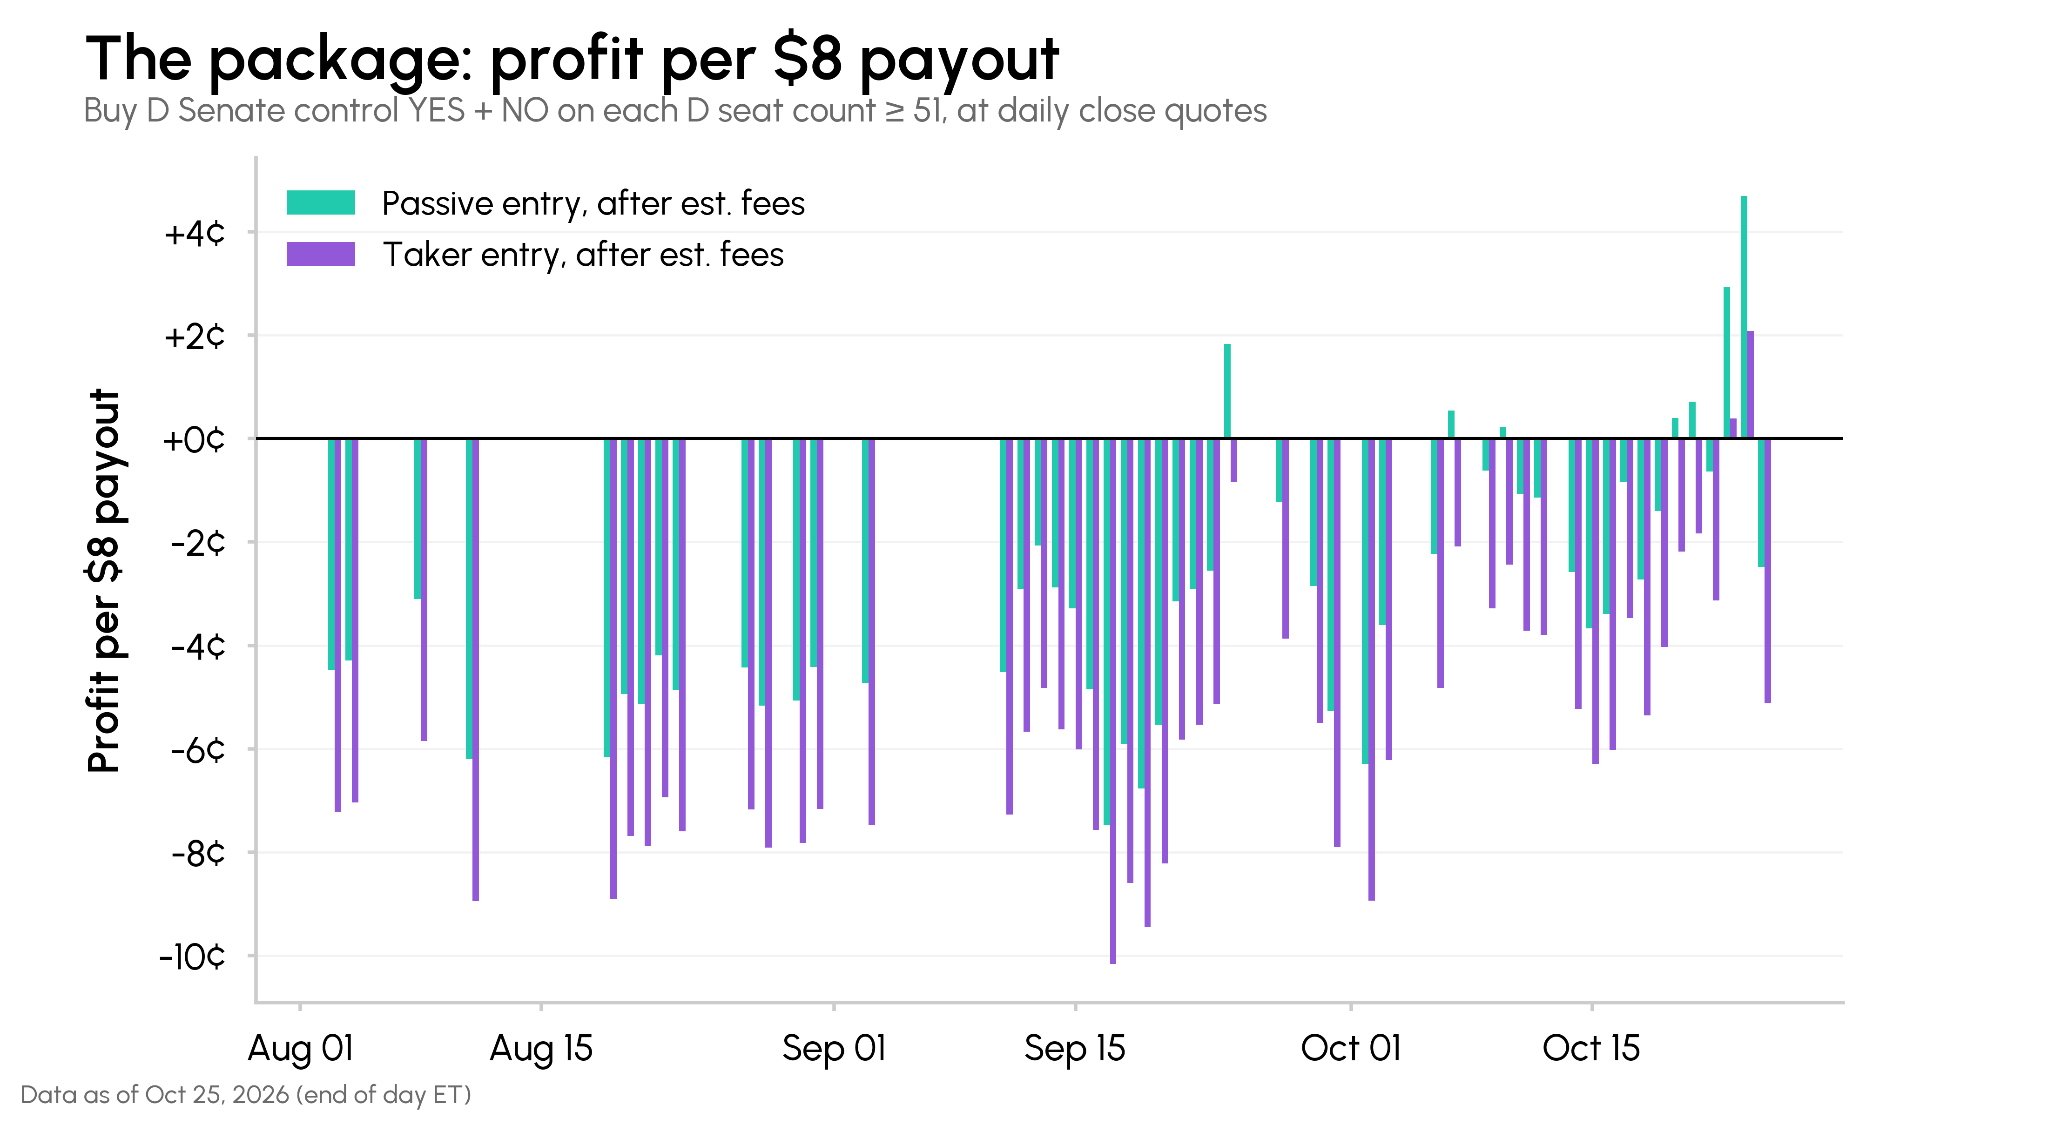
Source: Kalshi market data, Talos analysis. Hypothetical results at end-of-day quotes. Estimated fees use Kalshi’s taker fee formula, 0.07 × P × (1 − P) per contract, unrounded. The passive series assumes the control leg fills at the bid with no fee.
Using end-of-day quotes since August (all results hypothetical):
- Before fees, the package was priced below $8 on 19 of 51 days when every leg was valued at the ask.
- After estimated fees (about 5.2¢ per package on average), the modeled edge was positive on only 2 days with every leg crossing the spread. Assuming a resting bid on the control leg fills and only the hedges cross the spread, it was positive for 7 days, peaking at +4.7¢ per $8 (0.6%) on Oct 24.
- An order-book snapshot on Oct 25 priced ten packages at $79.65 including estimated fees against an $80.00 payout (+0.44%, about 1.63% annualized assuming settlement on Feb 1, 2027). No orders were executed.
Most positive days occurred in the final two weeks, as election-driven trading picked up.
Why the Gap Persists
If the payoff is fixed, why doesn’t the gap close? Liquidity is the main answer.
Source: Kalshi market data, Talos analysis
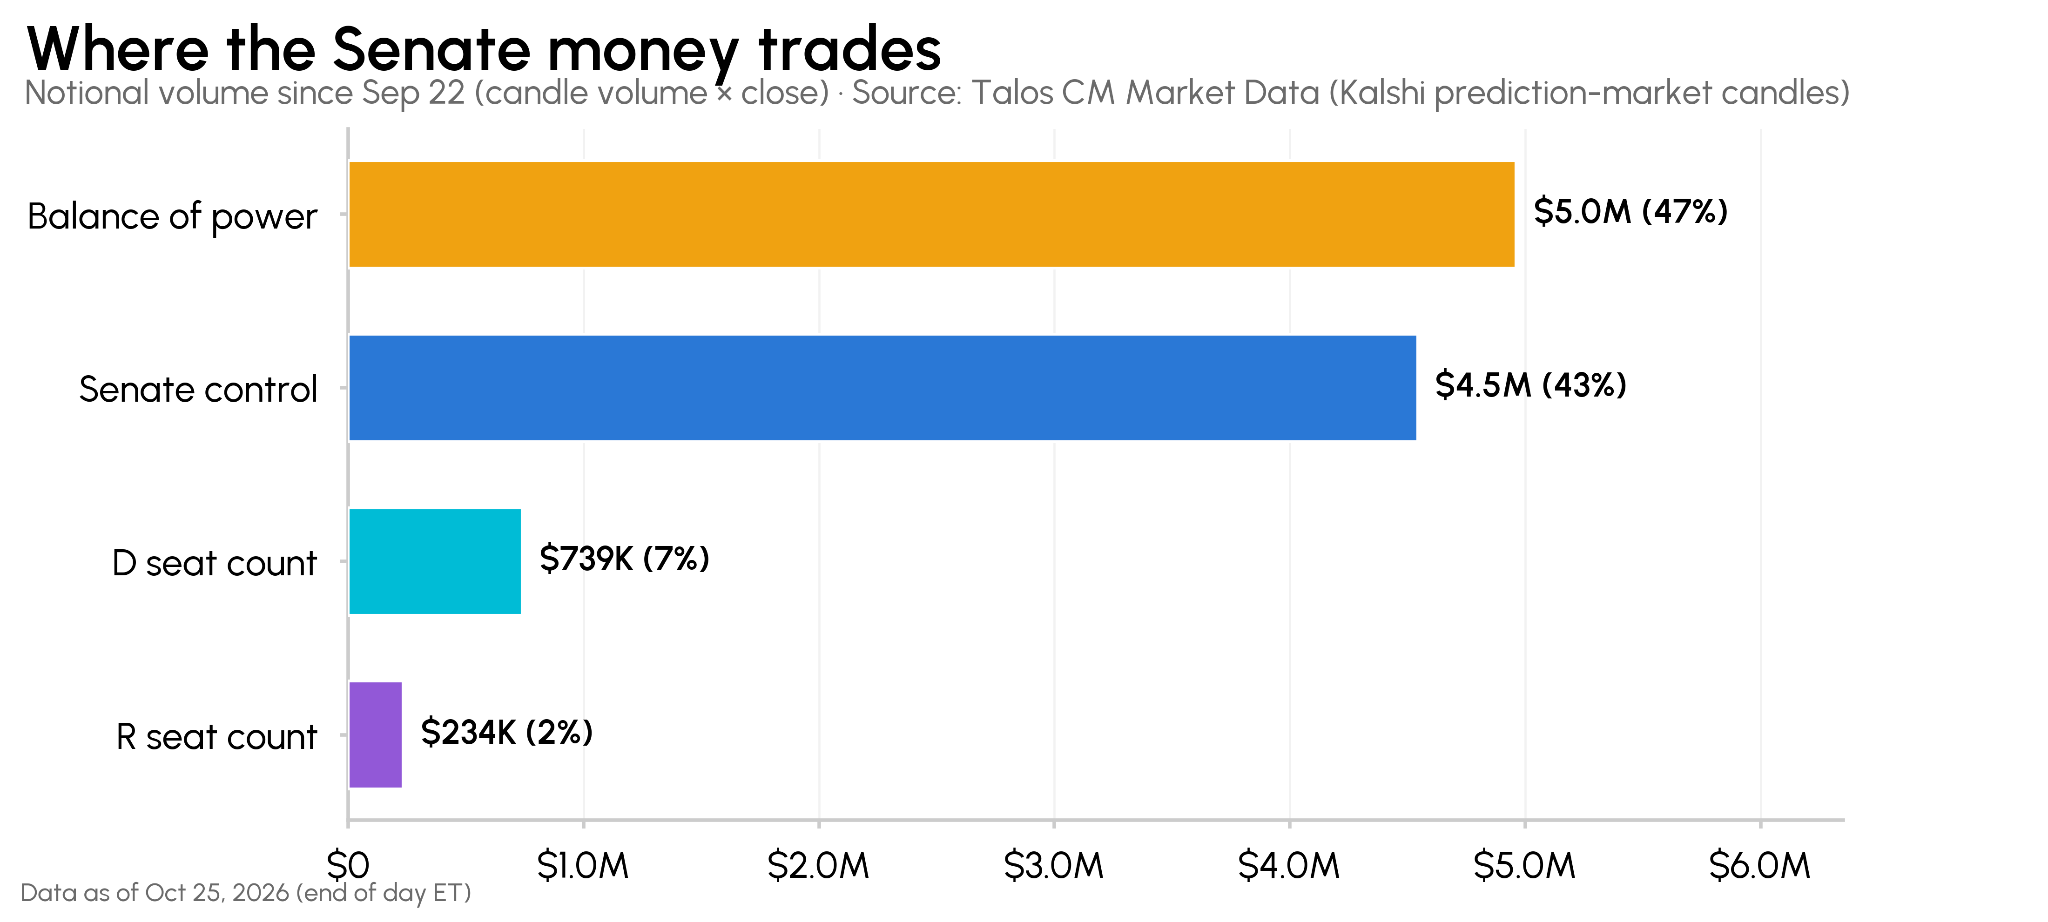
Since August, the Senate contracts have traded about $14.3M in notional. Over 90% of it went to Senate control (43.8%) and balance-of-power (47.5%) contracts. The Democratic and Republican seat-count ladders together traded under 10%.
Source: Kalshi market data, Talos analysis
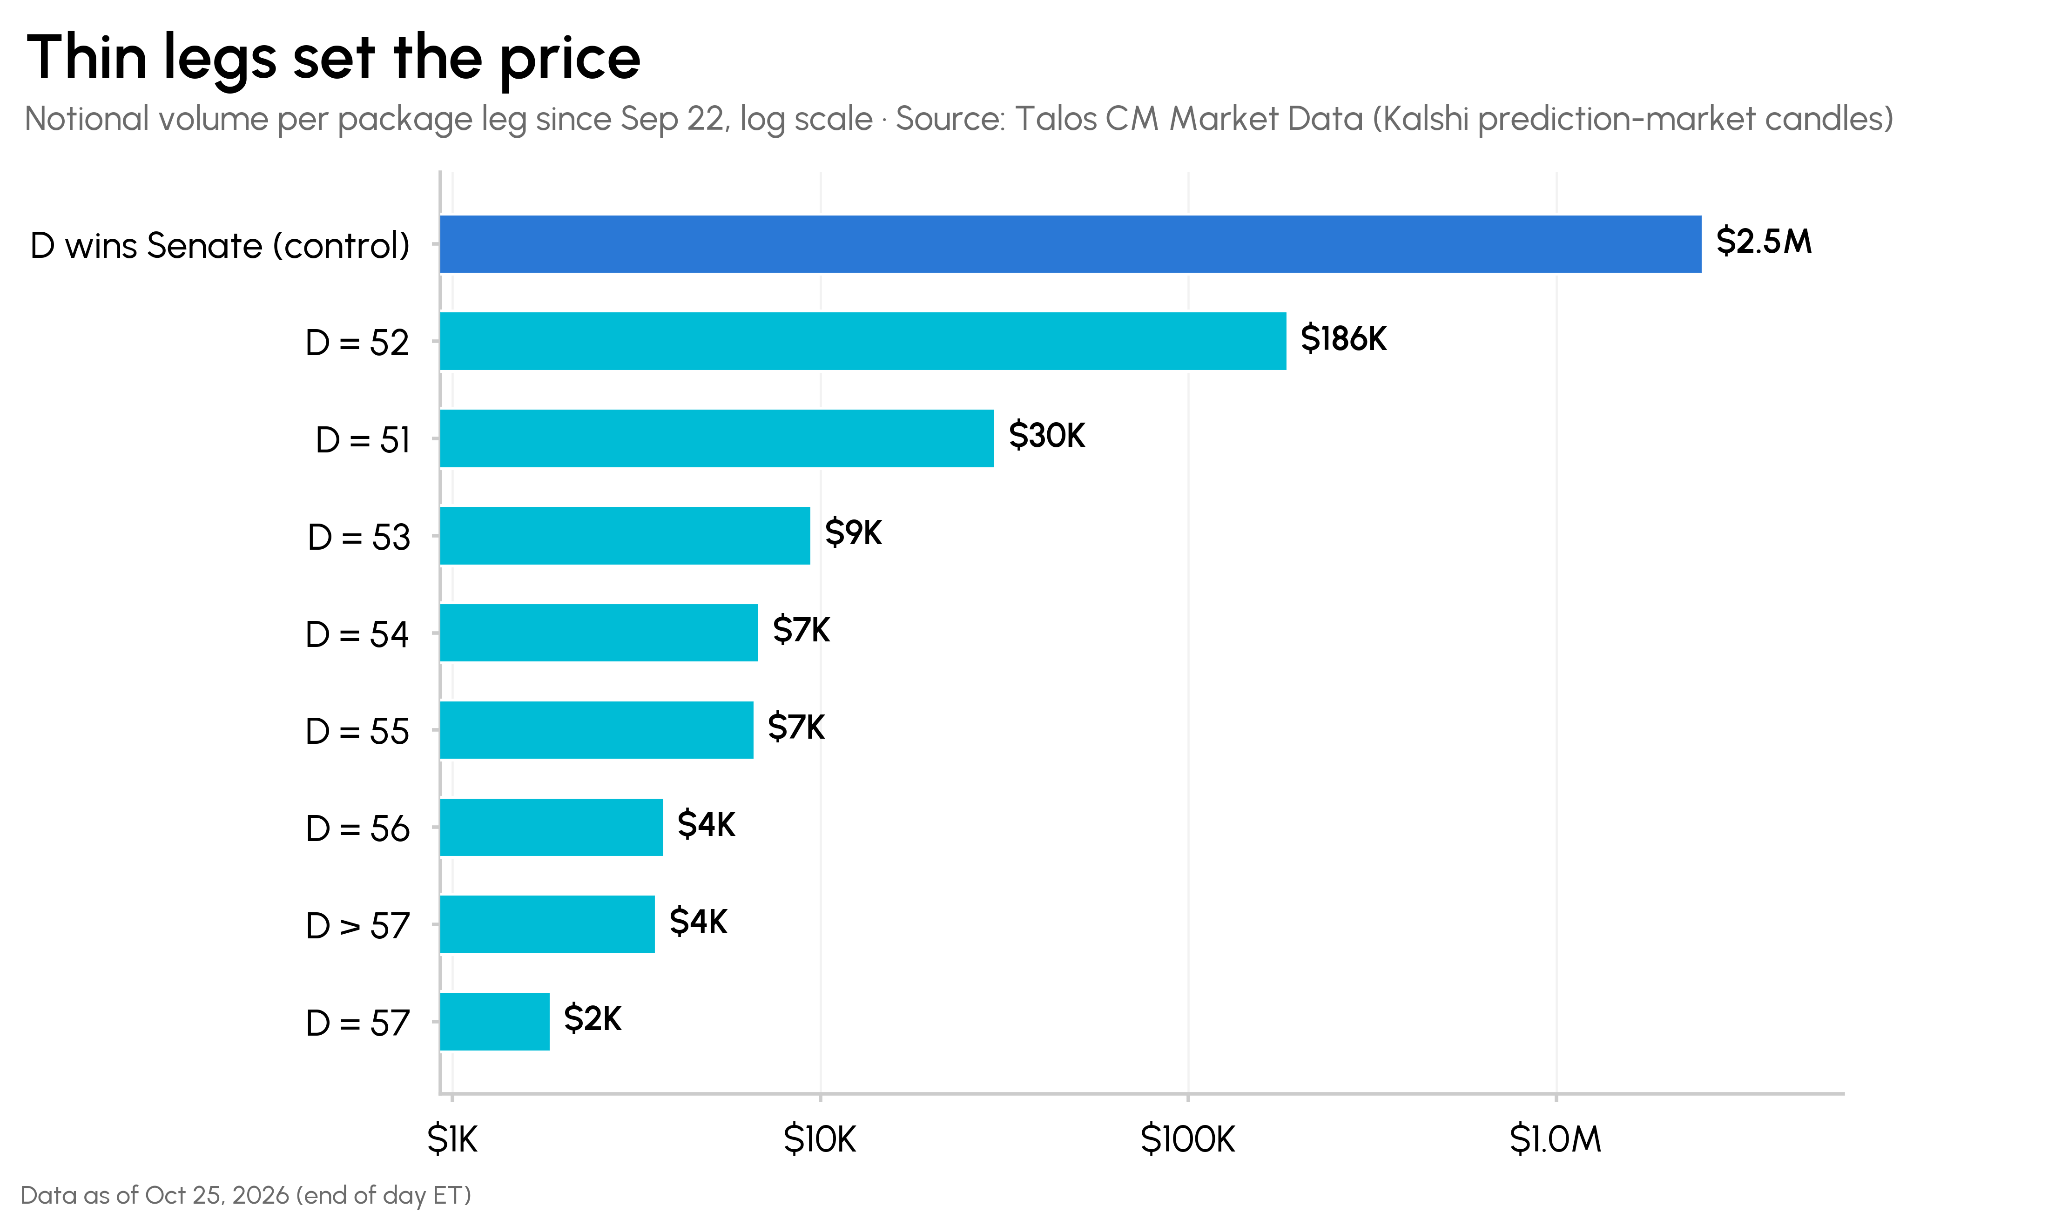
The package depends on its thinnest legs. The Democratic control contract traded $3.3M, while the “D = 57” and “D > 57” contracts traded $2K–4K each. In the Oct 25 snapshot, several hedge legs showed fewer than 110 contracts at the best ask. A modeled edge at 10 packages shrinks quickly at 1,000.
Several other frictions are worth noting:
- Legging risk. Nine orders have to fill before the payoff is secured. Prices on the remaining legs can move while the first ones fill.
- Fees. Kalshi’s fee is highest near 50¢ and falls toward 0¢ and 100¢. Estimated fees (about 5.2¢ per package on average) could exceed the pre-fee edge.
- Settlement basis and timing. The package assumes “Democrats control the Senate” and “Democrats hold 51+ seats” resolve together. The control contract can resolve early on a consensus of media calls, while the seat-count contracts resolve on the Senate’s composition on Feb 1, 2027. A vacancy, party switch, or reversal of a close race between the vote and Feb 1 could make the two families settle differently, in which case the payout would not be $8 (3).
- Capital lock-up. Most of the package’s capital stays committed until the seat-count contracts resolve on Feb 1, 2027.
What It Means for Prediction Market Participants
The Senate is one example of a broader pattern. Monthly prediction market volume rose from under $5B in September 2025 to roughly $24B by April 2026 (3), and that growth has come with fragmentation:
- Many contracts per question. Talos CM prediction market reference data tracks more than 880,000 live Kalshi contracts (1). Elections, Fed decisions, economic releases and sports are each split across control, range, threshold and combination contracts.
- Many venues per question. Kalshi and Polymarket often list the same events with different contract designs, fees and settlement terms.
- Liquidity spreads thin. As the Senate data shows, headline contracts attract most of the volume while related contracts trade a fraction of it. Thin books are where prices drift apart, and where execution costs can erase a modeled edge.
For market makers and funds, capturing an edge like this would depend on two things:
1. Identify. Find contracts that pay on the same outcome, convert them to a common basis, and price every combination at real depth and after fees. That requires:
- A complete, normalized map of events and contracts across venues, grouping each contract under the question it answers.
- Resolution terms for every contract, since two contracts only offset if they settle on the same facts.
- Live order-book depth and venue fee schedules, because top-of-book prices overstate what can actually be captured.
2. Capture. An opportunity on a screen is not a profit in an account. In this case, that would mean resting a patient order on a liquid leg and then filling eight thin legs before prices move, without paying away the spread in fees. That requires:
- Coordinated multi-leg execution designed to reduce legging risk.
- Order handling that works through thin books rather than sweeping them.
- Pre-trade estimates of settlement P&L after fees, so marginal opportunities can be filtered out before capital is committed.
The same framework applies to any event where several contracts, or several venues, price the same outcome.
Conclusion
Prediction markets are often treated as one price per question. Kalshi’s Senate contracts show they are better understood as a set of related order books. Those books follow the same trend but disagree by a few points at a time, and the gaps have not closed even as volume has grown. On several days this month, those differences added up to a package with a modeled positive edge.
The midterms are one case study. As prediction markets grow larger and more fragmented, similar gaps may continue to appear across events and venues. Assessing them takes two capabilities: complete data to find them, and a realistic view of execution costs to judge them.
For questions about prediction market data, contact us.
Methodology: Daily candlesticks for 38 Kalshi Senate contracts (Aug 1 – Oct 25, 2026) from the Kalshi public API, each labeled by its Eastern-time trading day. All contracts in the package were listed on Kalshi before August 2026. Implied probabilities use the mid of end-of-day bid and ask. Seat-count and balance-of-power probabilities are normalized by the sum of all outcomes in their ladder to remove the over-round created by bid-ask spreads. Package cost uses the ask for YES legs and 1 − bid for NO legs. Notional is contracts traded × price. Days without quotes on every leg are excluded. Contract universe from Talos CM prediction market reference data. Results are hypothetical, exclude slippage beyond quoted prices, and are not investment advice.
Notes
(1) Count of live Kalshi contracts in the Talos CM API endpoint /reference-data/markets (type=event_contract, exchange=kalshi), as of Oct 25, 2026 (882,762). The count changes daily as contracts expire and new ones are listed.
(2) CNN, “More than $1.4 billion has been traded on prediction markets for the 2026 midterms,” Oct 23, 2026, https://www.cnn.com/2026/10/23/politics/prediction-markets-midterm-elections-kalshi-polymarket.
(3) Pew Research Center, “Trading volume on prediction markets has soared in recent months,” May 27, 2026, https://www.pewresearch.org/short-reads/2026/05/27/trading-volume-on-prediction-markets-has-soared-in-recent-months/.
Disclaimer: The information herein is provided for informational purposes only. Talos Global, Inc. and its affiliates ("Talos") do not give any representations or warranties in relation to the accuracy, validity, or completeness of the information of this material, including without limitation the factual information obtained from publicly available sources considered by Talos to be reliable at the time. Talos accepts no liability for any consequences of using the information contained in this material. Any opinions or estimates expressed herein reflect a judgment made by the authors as of the date of publication and are subject to change without notice. Neither this material nor any copy thereof may be taken, reproduced, or redistributed, directly or indirectly, without Talos's prior written permission. Any views or opinions expressed are those of the authors and do not necessarily reflect the views of Talos. This communication does not constitute an offer to buy or sell, or a promotion or recommendation of, any digital asset, security, derivative, commodity, financial instrument, prediction market contract or product, event contract, or trading strategy. References to prediction markets or event-based contracts are for informational purposes only and describe financial instruments traded on regulated or licensed venues. They do not constitute, gambling, wagering, or betting activity, nor should they be construed as such, and Talos does not offer, operate, or facilitate gambling services of any kind. This document and information are not intended to constitute investment advice or a recommendation to make (or refrain from making) any kind of investment decision, including with respect to prediction markets or event contracts, and may not be relied on as such.
Subscribe
If you’d like to get State of the Network in your inbox, please subscribe below.
Latest insights and research



Request a demo
Find out how Talos can simplify the way you interact with the digital asset markets.