

Robinhood Chain and the Race to Build a Financial Super App
State of the Network #373
Robinhood Chain and the Race to Build a Financial Super App

Introduction
State of the Network #373
Coin Metrics State of the Network is an unbiased, weekly view of the crypto market informed by our own network (on-chain) and market data.
Key Takeaways:
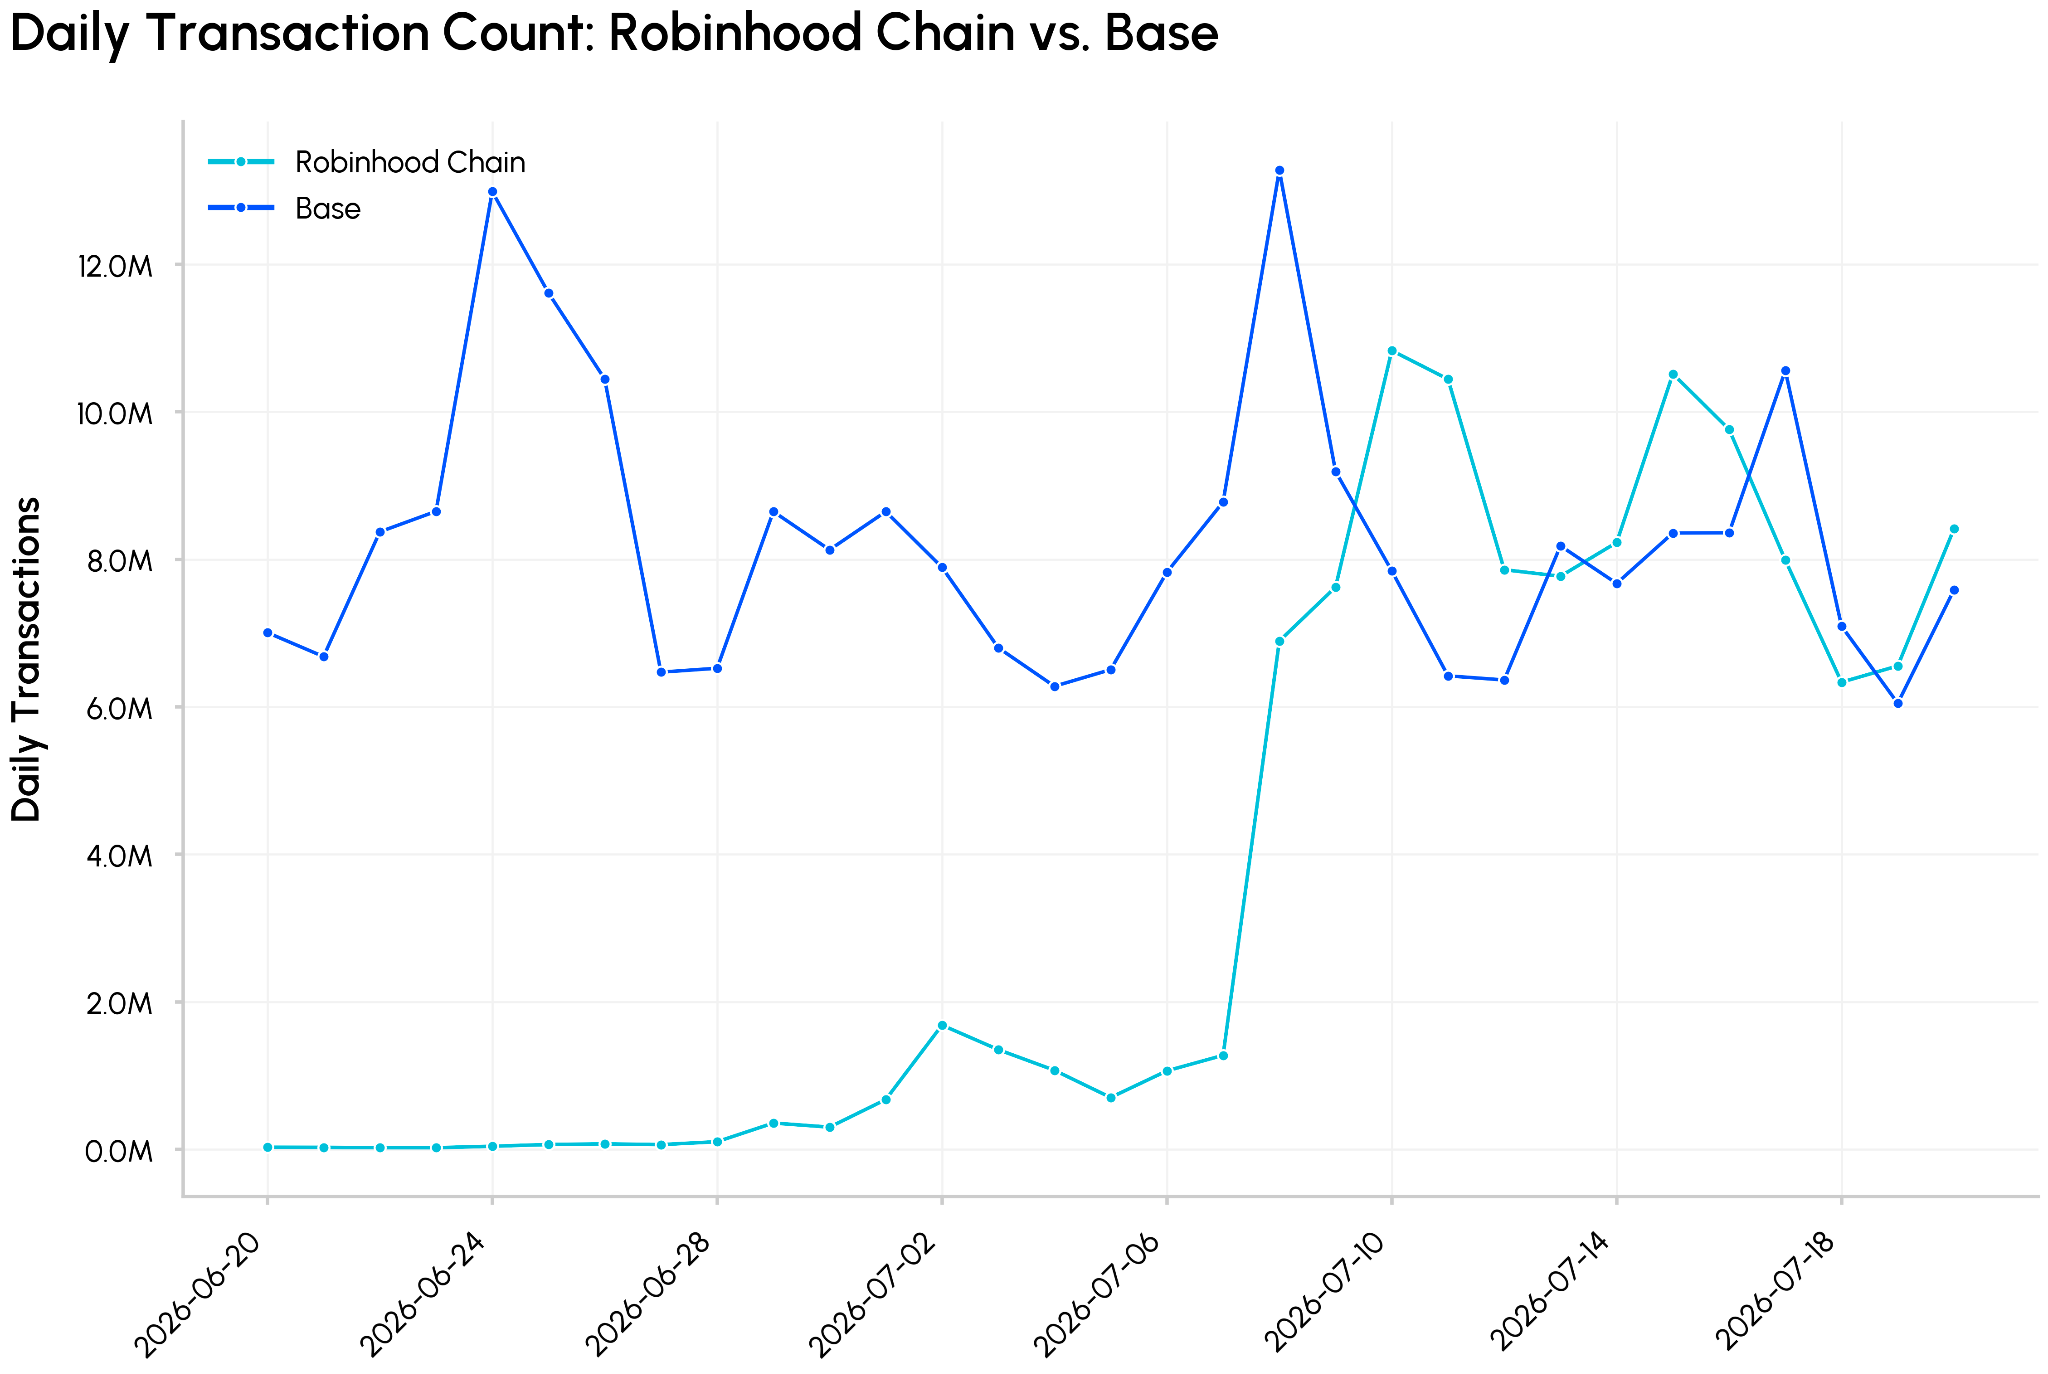
- Since launching just three weeks ago, Robinhood Chain has already attracted over $200M in bridged ETH and processed more than 130M transactions, putting its daily activity on par with Coinbase’s Base.
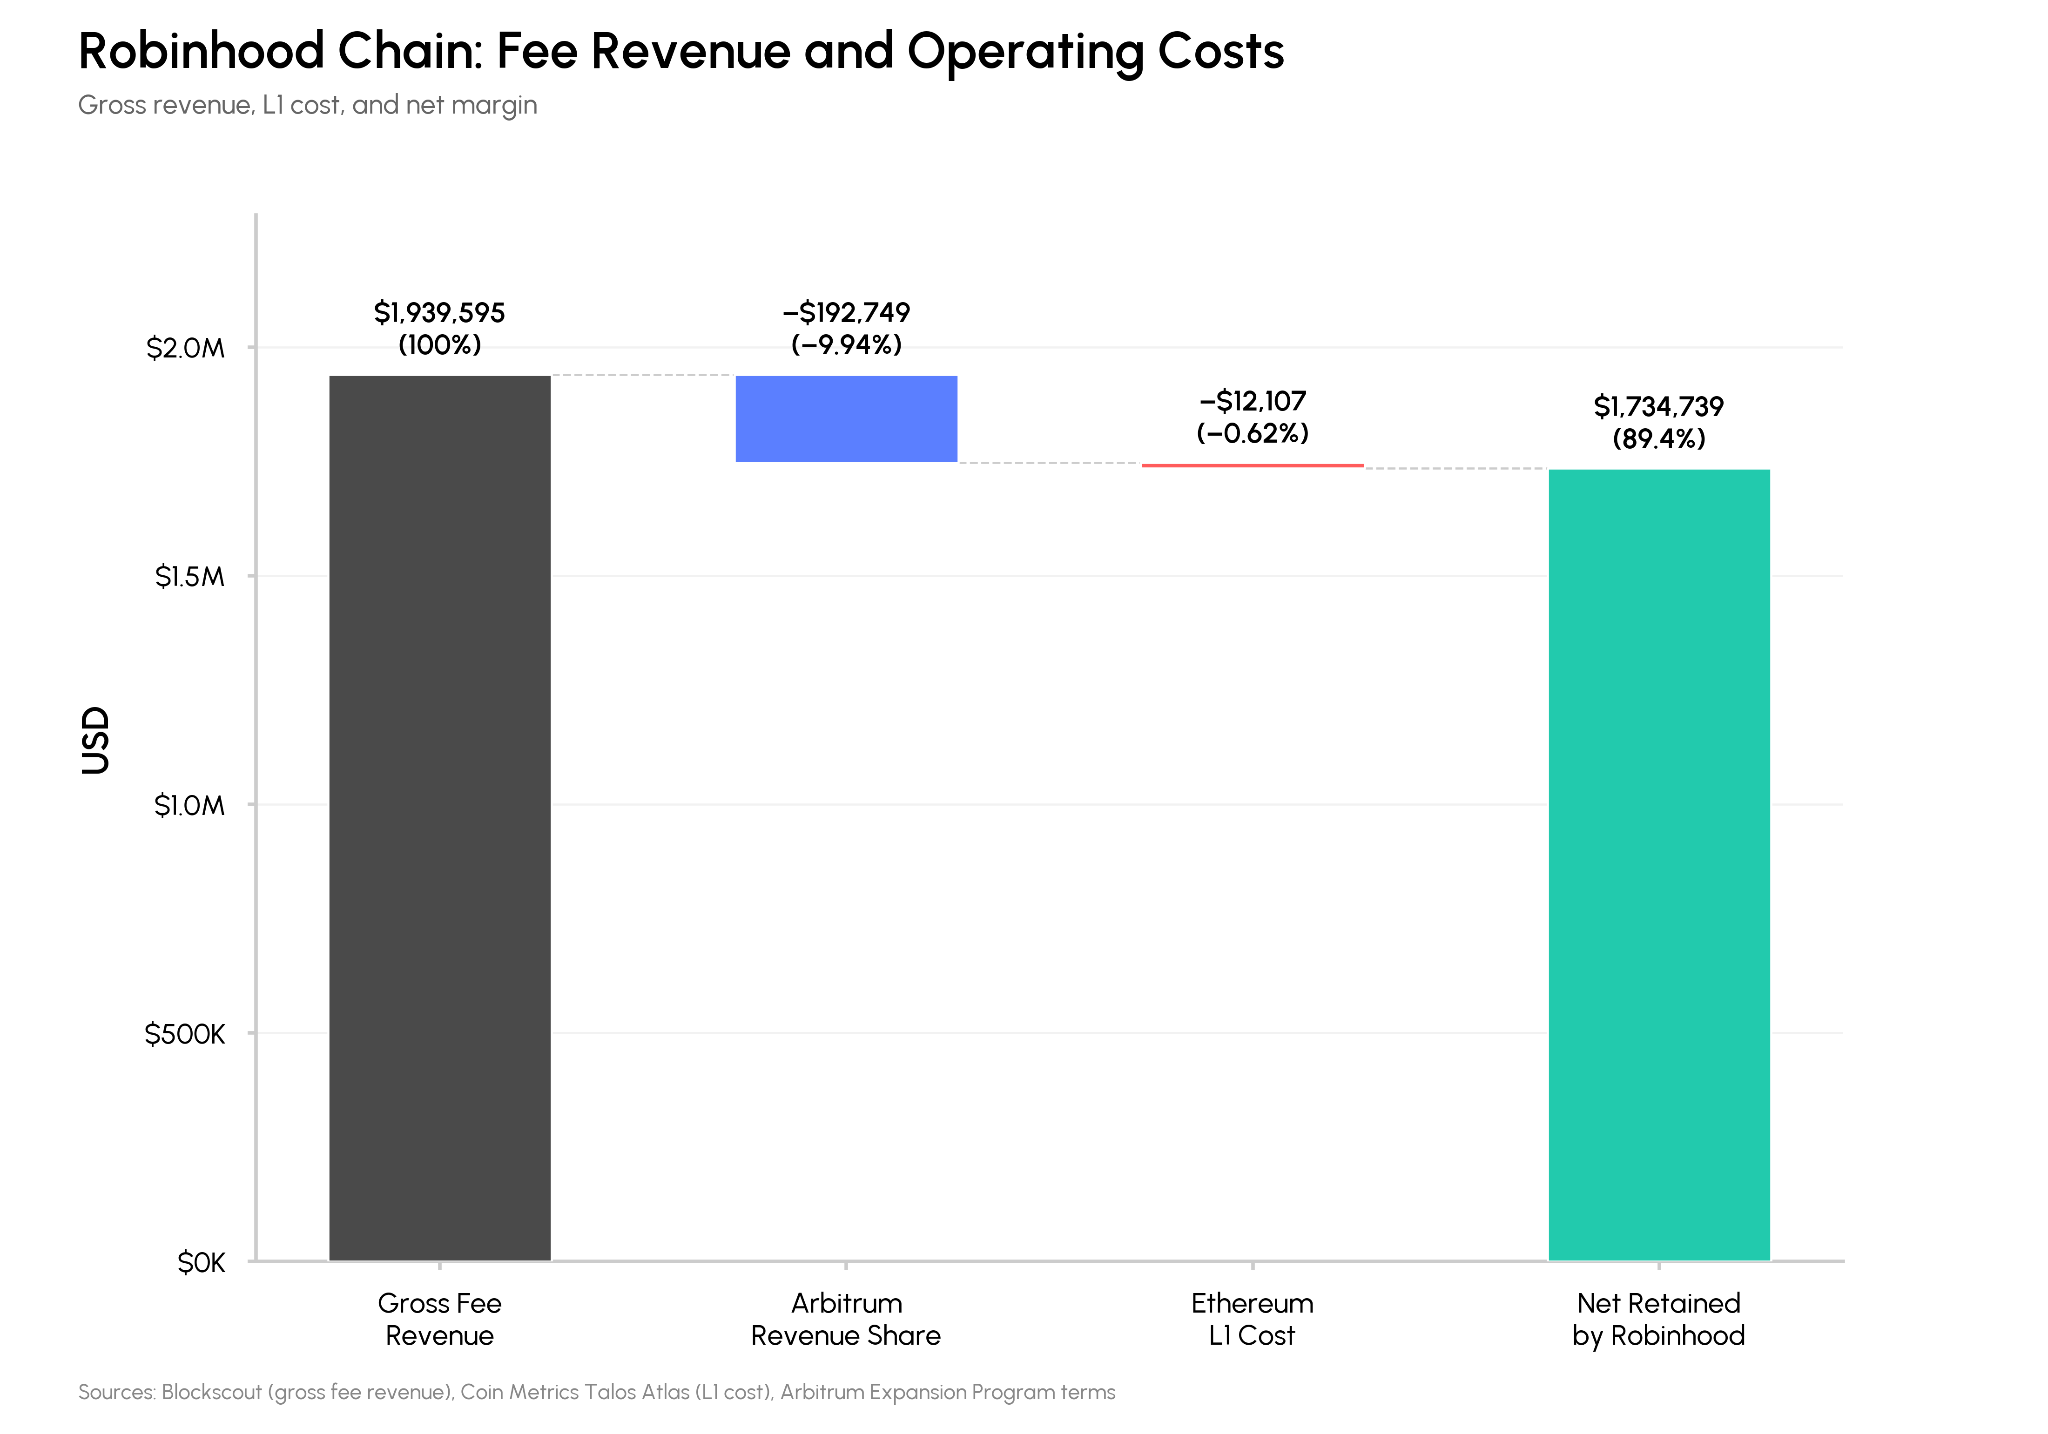
- Robinhood Chain has already generated around $1.9M in fee revenue, retaining high margins with about 10% shared with Arbitrum for its rollup infrastructure and less than 1% paid to Ethereum for data availability and settlement.
- A growing supply of stablecoins and tokenized stocks now provides the building blocks for lending vaults and 24/7 equity trading, the onchain financial infrastructure Robinhood is building toward.
Introduction
With the launch of Robinhood Chain, one of the largest retail brokerages has now entered the race to build a financial “super app” that brings together traditional markets, crypto, and tokenized RWAs. A key part of this strategy is an onchain settlement layer powered by Robinhood’s global reach. At Robinhood’s “World is Flat” event, the company unveiled a range of products including its own Layer-2 blockchain, a model that has become increasingly common among exchanges such as Coinbase (Base) and Kraken (Ink).
Early user activity and onchain data point to Robinhood Chain gaining rapid traction, with over $200M in ETH bridged, roughly 130M total transactions, and about $1.9M in transaction‑fee revenue so far (as of July 20th). Because Robinhood retains most of the network’s revenue, the launch has already renewed questions about Ethereum’s Layer‑2 economics and how much value the base layer ultimately captures.
In this issue of State of the Network, we provide an overview of Robinhood Chain, examine its early onchain usage compared to other Layer‑2 networks, and outline the economic relationship between Robinhood Chain and Ethereum.
Robinhood Chain Overview
Robinhood Chain is an Ethereum Layer-2 using the Arbitrum Orbit stack, operated by Robinhood. It’s focused on tokenized real-world assets (such as Stock Tokens and ETFs) and onchain financial services including 24/7 trading, lending, and borrowing with sub second block times (~100ms). The chain is compatible with EVM tooling and applications, utilizes Ethereum for data availability and security, while using ETH as the native gas token.
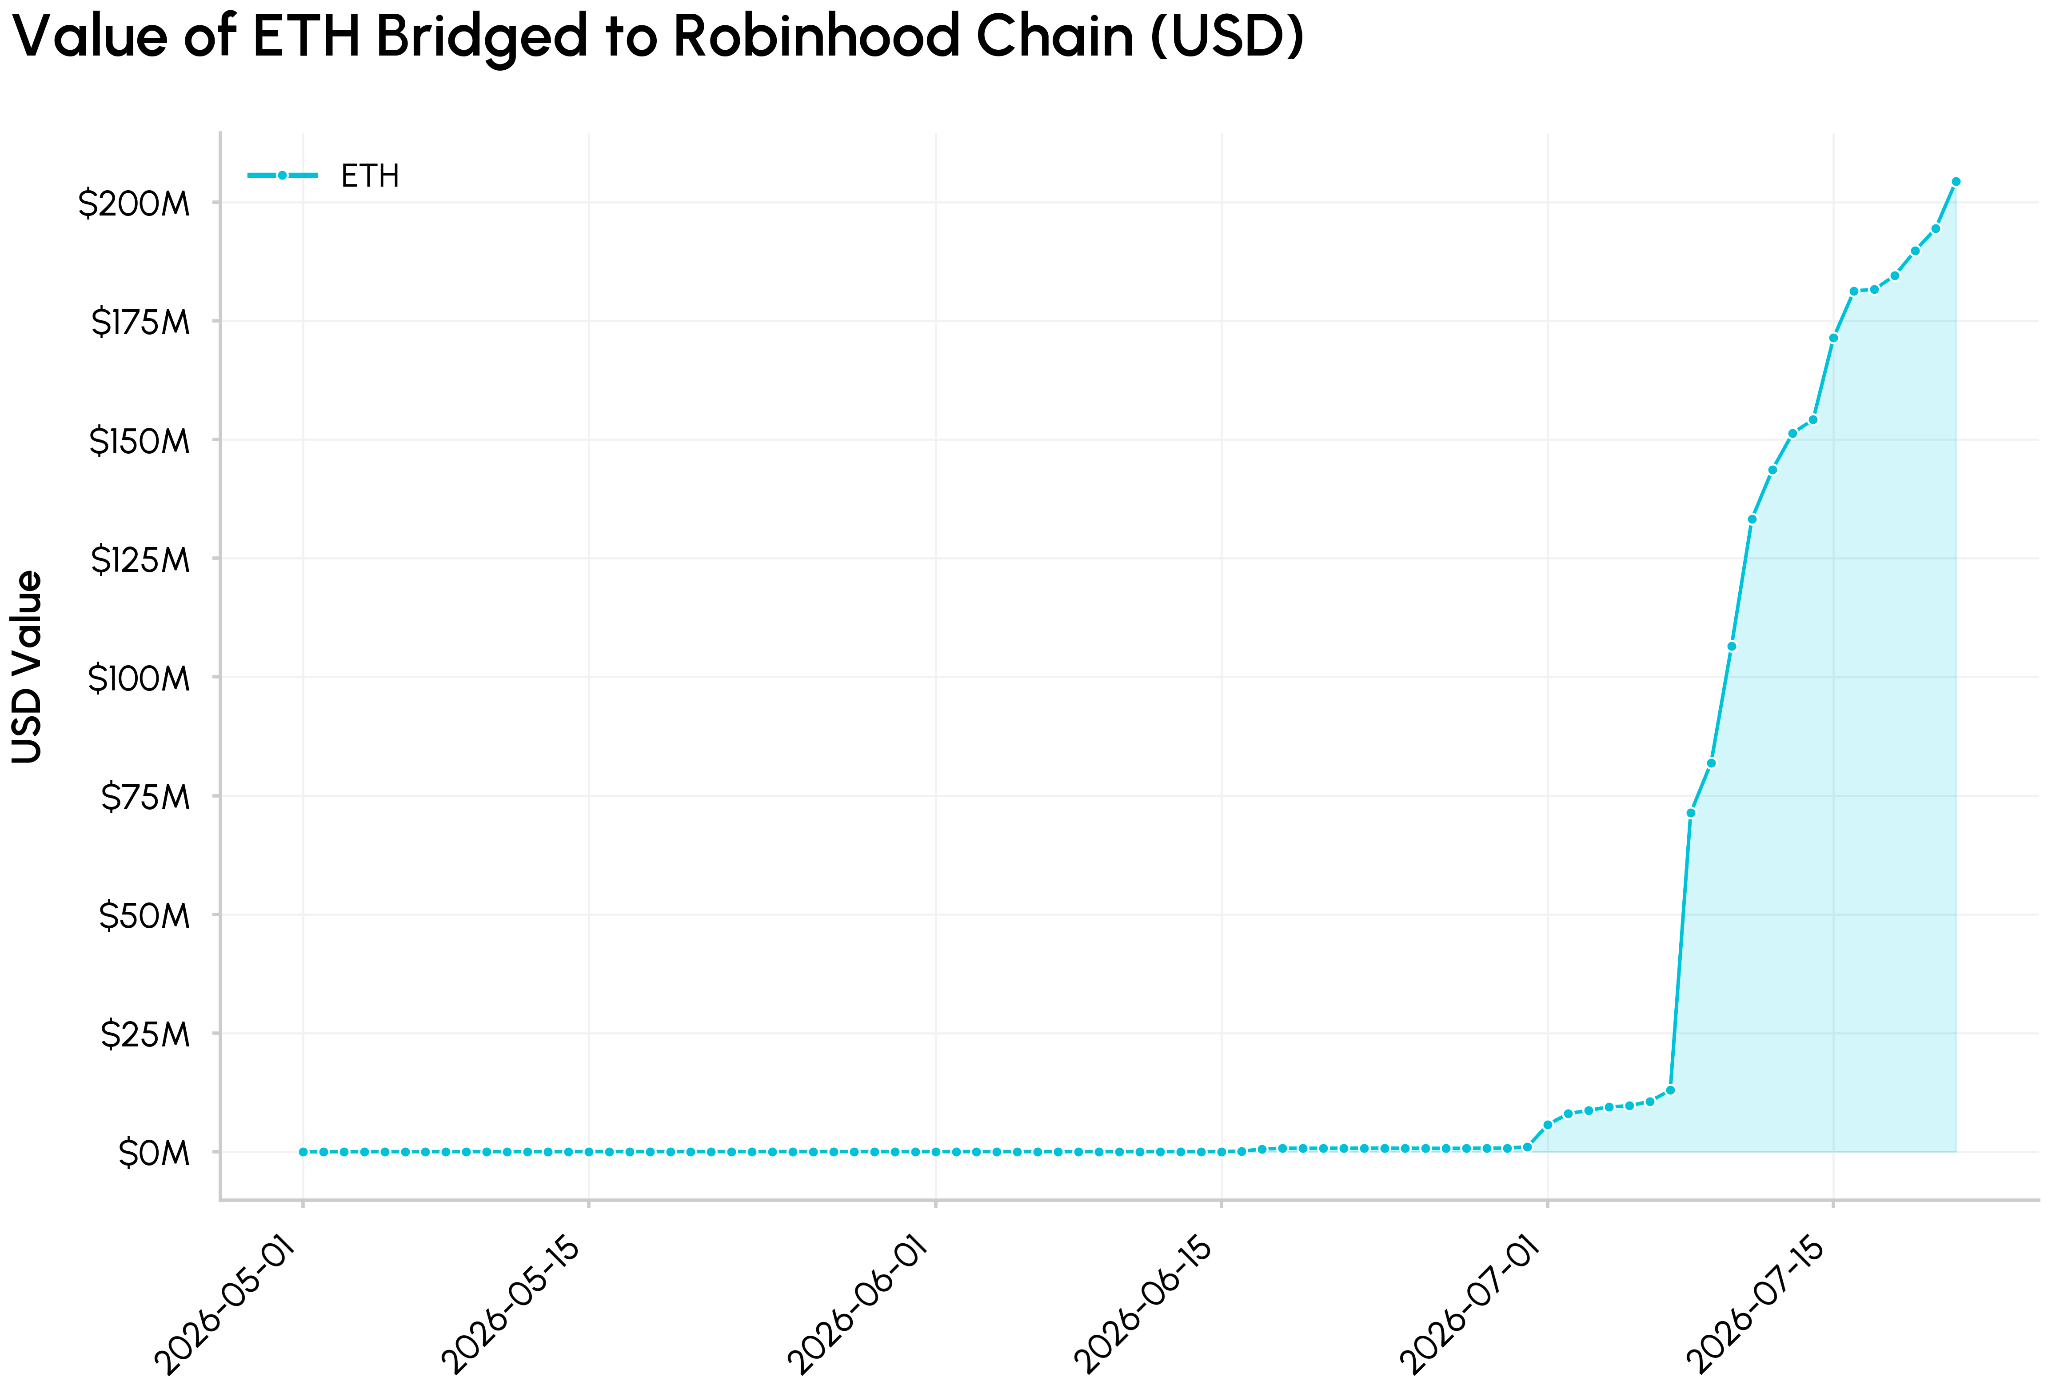
Since mainnet launch on July 1st, Robinhood chain has quickly attracted liquidity and early adoption. Over $200M in ETH has already been bridged to Robinhood Chain (escrowed on Ethereum and minted on Robinhood Chain) to spend, trade or use as collateral. This is evidence of its early traction as users commit capital and generate demand for ETH as gas and collateral.
Memecoins, Stablecoins and Tokenized Stocks
Robinhood Chain has accumulated roughly $700M in liquidity, with ETH representing 28% ($205M) of total value. However, early traction was driven by speculative activity around Cash Cat, a natively minted memecoin that quickly reached a ~$200M market cap, helping bootstrap initial liquidity and user engagement.
The chain also hosts $430M in stablecoin supply, consisting of Global Dollar (USDG) which is natively issued on the chain and Ethena’s USDe (externally bridged). These stablecoins underpin Robinhood’s Earn product, built on Morpho vaults curated by Steakhouse Financial which has already reached $163M in total deposits.
USDG is a consortium stablecoin issued by Paxos and distributes a share of reserve interest to partners within the Global Dollar Network, creating an incentive structure similar to models like OpenUSD (OUSD). This not only supports onchain liquidity but also aligns distribution partners such as Robinhood with the growth of USDG supply, providing an additional source of revenue tied to the expansion of its stablecoin base.
Source: Talos CM Network Data Pro & Blockscout Robinhood Chain Explorer
This liquidity has translated into strong onchain activity: daily transactions on Robinhood Chain already rival Coinbase’s Layer-2 network Base, with around 270K daily active addresses and roughly 3.4M total addresses so far.
Activity is currently driven by a mix of speculative memecoin trading via Uniswap, Lighter, and other spot/perpetuals DEXs, Morpho vault infrastructure, and early growth with tokenized equities through Robinhood Stock Tokens. Robinhood’s tokenized equities are ERC-20 tokens that follow a similar model to Backed xStocks, structured as tokenized debt securities that provide economic exposure to underlying assets held at custodians.
Whether this initial burst matures into sustainable usage across the chain’s intended use cases, particularly around RWAs and onchain financial products, remains an important trend to watch.
Robinhood Chain Economics: Fee Revenue & Operating Costs
The value generated from this activity ultimately accrues to distinct parts of the stack. Since launch, Robinhood Chain has earned roughly $1.94M in gross transaction‑fee revenue, the total fees users pay on the L2. Of this amount, about 10% (~$193K) is shared with Arbitrum for providing the rollup infrastructure and execution environment, and less than 1% (~$12K) has gone to Ethereum for data availability and security. The remaining ~89% (~$1.73M) is retained by Robinhood, reflecting how L2 operators capture the bulk of the value from application usage.
Robinhood Chain currently uses first‑come, first‑served (FCFS) sequencing. Transaction order is set by arrival time rather than auction, meaning the chain does not capture additional revenue from transaction ordering or MEV in the way some sequencers do.
Source: CM Talos Network Data Pro & Blockscout Robinhood Chain Explorer
This pattern is not unique to Robinhood; L1 costs (for data availability and settlement) are a small fraction of total fee income across major Layer-2s. These networks consistently generate higher fee revenue than they pay out to Ethereum for data availability and settlement despite occasional high demand spikes.
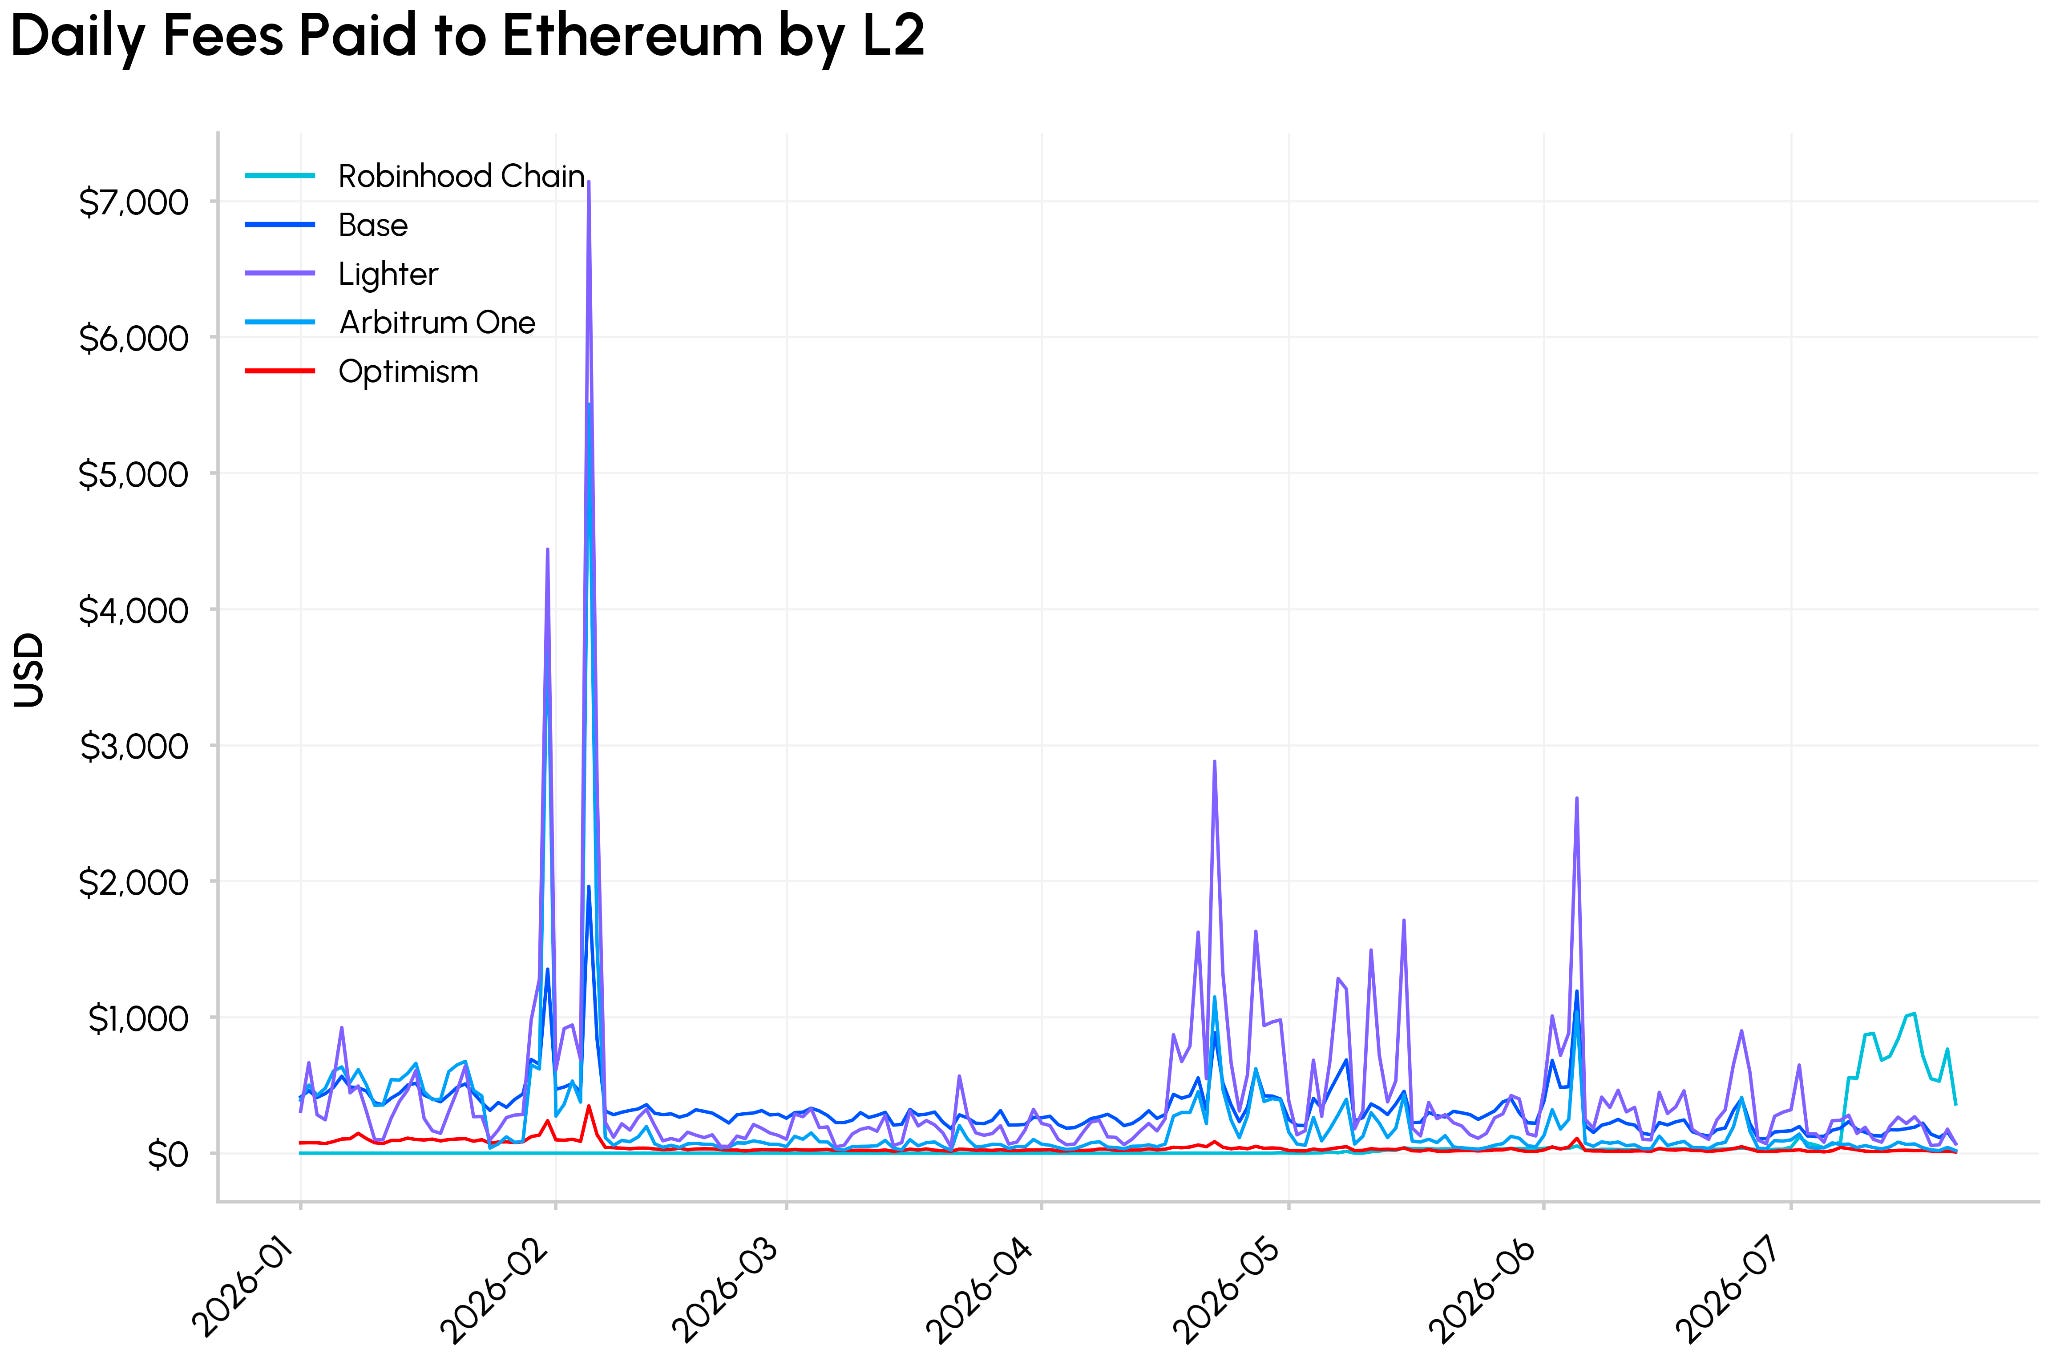
As the table below shows, Base has generated $30.08M in gross fee revenue in 2026 so far while paying $65.5K to Ethereum and sharing roughly $4.5M with the Optimism Collective, retaining about $25.5M in net margin and operating at roughly 85% profitability. Robinhood Chain, which has been on mainnet for less than a month, is retaining about $1.73M of $1.94M in fees (~89%) while paying just over $12K to Ethereum and sharing 10% (~$193K) with Arbitrum under its fee‑sharing program.
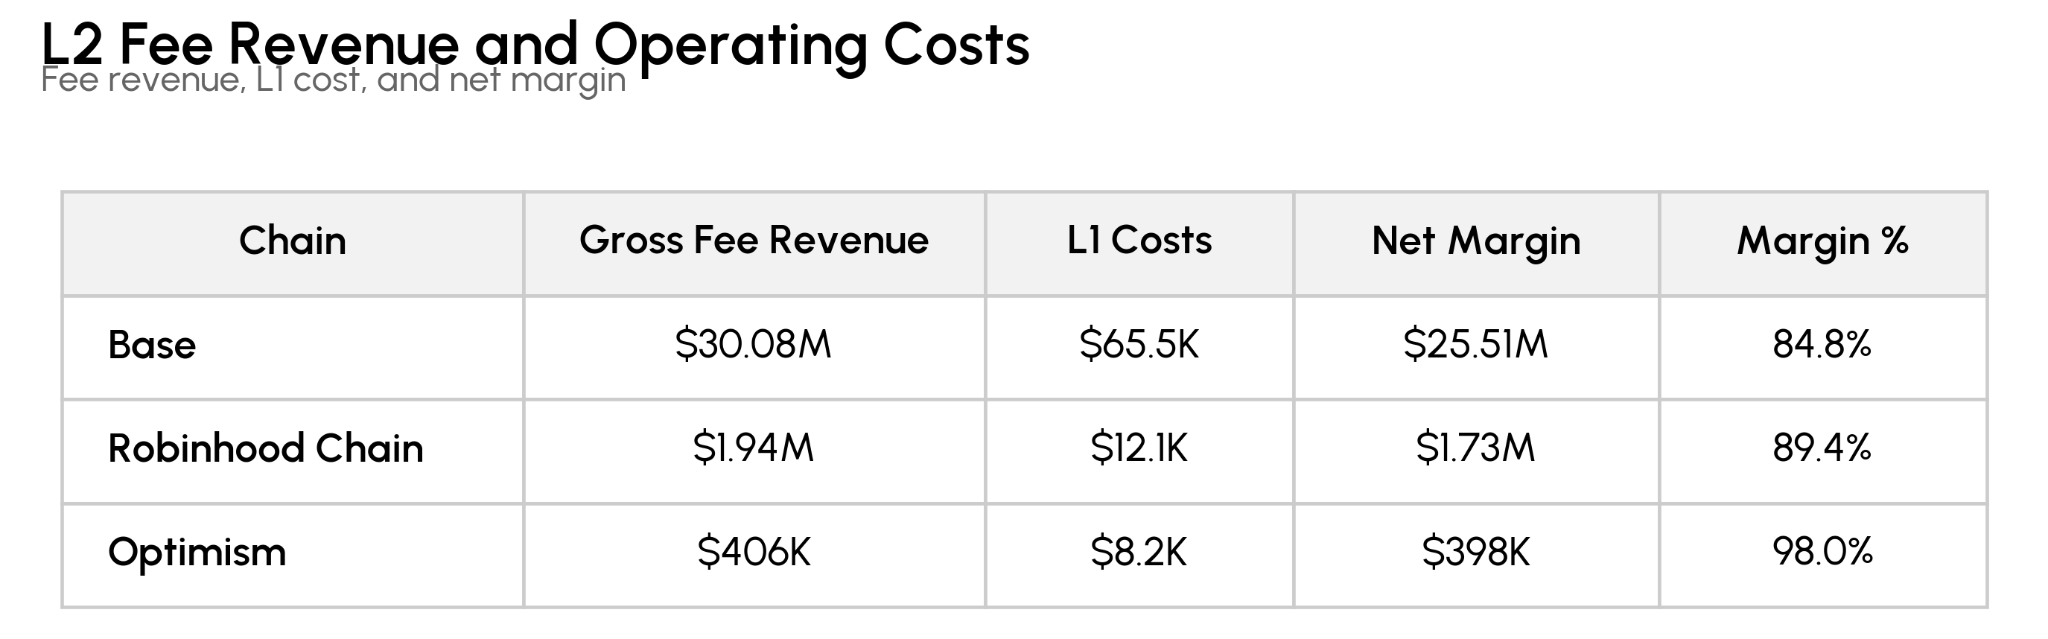
For Ethereum, this has resurfaced a familiar tension. Layer‑2s and their stacks capture the bulk of direct fee revenue, but their growth creates network effects that expand the ecosystem, increasing demand for ETH as gas and for Ethereum as the neutral settlement layer that secures these high‑margin application chains.
Conclusion
Robinhood Chain has quickly become a high‑activity, high‑margin Layer‑2, bootstrapped by memecoins and stablecoin liquidity and a growing base of tokenized equities. Its economics highlight how Robinhood can capture most of the fees generated by user activity while relying on Ethereum for security and settlement.
Whether this initial burst matures into sustainable usage across the chain’s intended use cases, particularly around RWAs and onchain financial infrastructure built on 24/7 markets and Robinhood’s global distribution, remains an important trend to watch as the convergence of these markets accelerate.
Subscribe and Past Issues
Coin Metrics State of the Network is an unbiased, weekly view of the crypto market informed by our own network (on-chain) and market data.
If you’d like to get State of the Network in your inbox, please subscribe here. You can see previous issues of State of the Network here.
Disclaimer: The information herein is provided for informational purposes only. Talos Trading, LLC and its affiliates (“Talos”) does not give any representations or warranties in relation to the accuracy, validity, or completeness of the information of this material, including without limitation the factual information obtained from publicly available sources considered by Talos to be reliable at the time. Talos accepts no liability for any consequences of using the information contained in this material. Any opinions or estimates expressed herein reflect a judgment made by the author(s) as of the date of publication and are subject to change without notice. Neither this material nor any copy thereof may be taken, reproduced, or redistributed, directly or indirectly, without Talos’s prior written permission. Any views or opinions expressed are those of the authors and do not necessarily reflect the views of Talos. This communication does not constitute an offer to buy or sell, or a promotion or recommendation of, any digital asset, security, derivative, commodity, financial instrument, or product or trading strategy. This document and information are not intended to constitute investment advice or a recommendation to make (or refrain from making) any kind of investment decision and may not be relied on as such.
Subscribe
If you’d like to get State of the Network in your inbox, please subscribe below.
Latest insights and research




Request a demo
Find out how Talos can simplify the way you interact with the digital asset markets.