
Before the First Fill: Quantitative Pre-Trade Analytics and the Agentic Future of Digital and Multi-Asset Execution
Talos's Head of Quantitative Execution Services, Eliad Hoch breaks down how institutions can finally estimate execution costs in digital assets before they trade.
Before the First Fill: Quantitative Pre-Trade Analytics and the Agentic Future of Digital and Multi-Asset Execution

Introduction
Talos's Head of Quantitative Execution Services, Eliad Hoch breaks down how institutions can finally estimate execution costs in digital assets before they trade.
In equity markets, no institutional desk sends a large order without first asking a simple question: what is this likely to cost, and how should I trade it? Pre-trade transaction cost analysis has been standard practice there for decades. In digital assets, it has been mostly non-existent. Traders with strong conviction on what to buy still routinely leave the how to chance, paying for it in slippage, the quiet tax that erodes the performance.
Our recent research into crypto market structure makes pre-trade cost estimation a reality. The framework that follows draws on a calibrated market impact model validated against over 50,000 institutional orders, and on execution alphas — forecasts of intraday volume, volatility, and spreads — that make participation rate estimable before a trade is executed.
Same Order, Four Different Assets
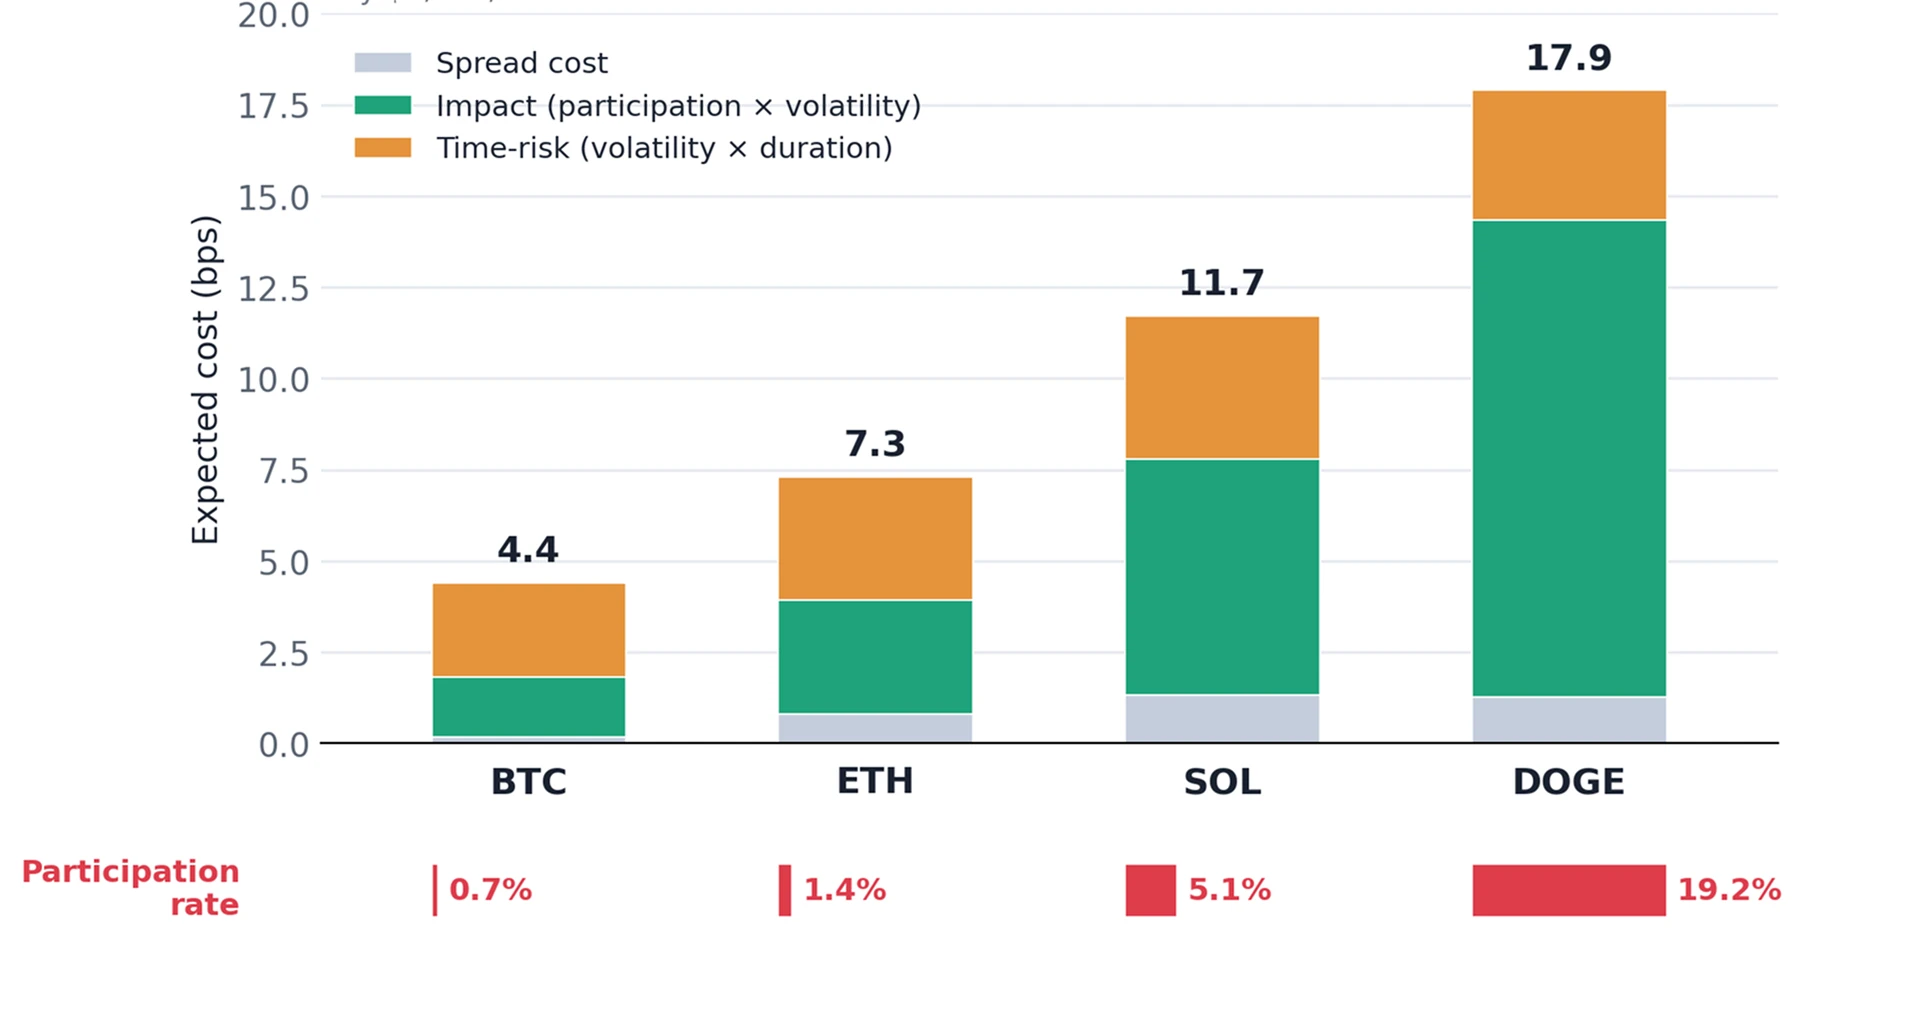
To make the cost of that gap concrete, consider a simple experiment. Take one order instruction: buy $1,000,000 over one hour, on a VWAP schedule, sourcing liquidity from a consolidated view of more than 50 venues, and run it for four assets: BTC, ETH, SOL and DOGE. Identical order size, identical duration, identical time of day. The expected cost is anything but identical:
- 4.4 bps for BTC
- 7.3 bps for ETH
- 11.7 bps for SOL
- 17.9 bps for DOGE – the same order, four times the cost of BTC.
This is not surprising. Digital asset traders know that DOGE is statistically more impactful than BTC for equal sizing. We now have a way to quantify how much.
The interesting question is not which number is largest. It is why they differ, because that is what tells a trader whether to do anything differently. Figure 1 decomposes each order into spread, impact and time-risk, with the predicted participation rate set alongside.
Figure 1: One order, four assets: the same instruction, four very different costs. Expected cost of an identical $1m, 1-hour VWAP order, decomposed into spread, impact and time-risk, with predicted participation rate.
Two Levers a Trader Can Estimate Before Executing: Cost and Risk
Every expected cost (slippage versus arrival) estimate in our model resolves into two forces, each of which can be estimated before a single fill.
The first is the cost of demanding liquidity. It combines the spread you cross with the impact of your order pushing into the book, and that impact rises with intraday volatility and, above all, with your participation rate: the share of market volume you represent over the interval. The more of the available volume you try to consume, the more price moves against you. Because expected volume can be forecast, participation rate is estimated in advance, not merely measured afterwards. Across these four orders it is the dominant driver of the differences in cost: as predicted participation climbs from BTC through to DOGE, impact climbs with it, from under 2 bps on BTC to more than 13 on DOGE, where a $1m order is a far larger footprint relative to genuinely available liquidity. The red bars in Figure 1 make the point directly: predicted participation rises from well under 1% on BTC to roughly 19% on DOGE, tracking impact almost step for step.
The second lever is time risk, the exposure you take on simply by being in the market for, say, an hour rather than a minute. Prices drift; the longer your horizon, the more the market can move away from your arrival price. Time risk is derived from a volatility forecast over the chosen duration. Here it sits in a relatively tight band across the four assets, roughly 2.6 to 3.9 bps, indicating that for statistically average regimes, extending the horizon might be preferable, because it reduces the expected participation rate, and hence expected impact. But note that for BTC it is the larger half of the total. When impact is negligible, the dominant risk is not the book – it is the clock.
Which Lever Dominates
Plot cost against time risk, as in Figure 2, and the four orders occupy genuinely different regions of the same plane.
Figure 2 – The execution frontier: each asset sits in its own region of the plane. The same four orders on a cost-versus-risk plane: liquidity cost (spread + impact) against time-risk.
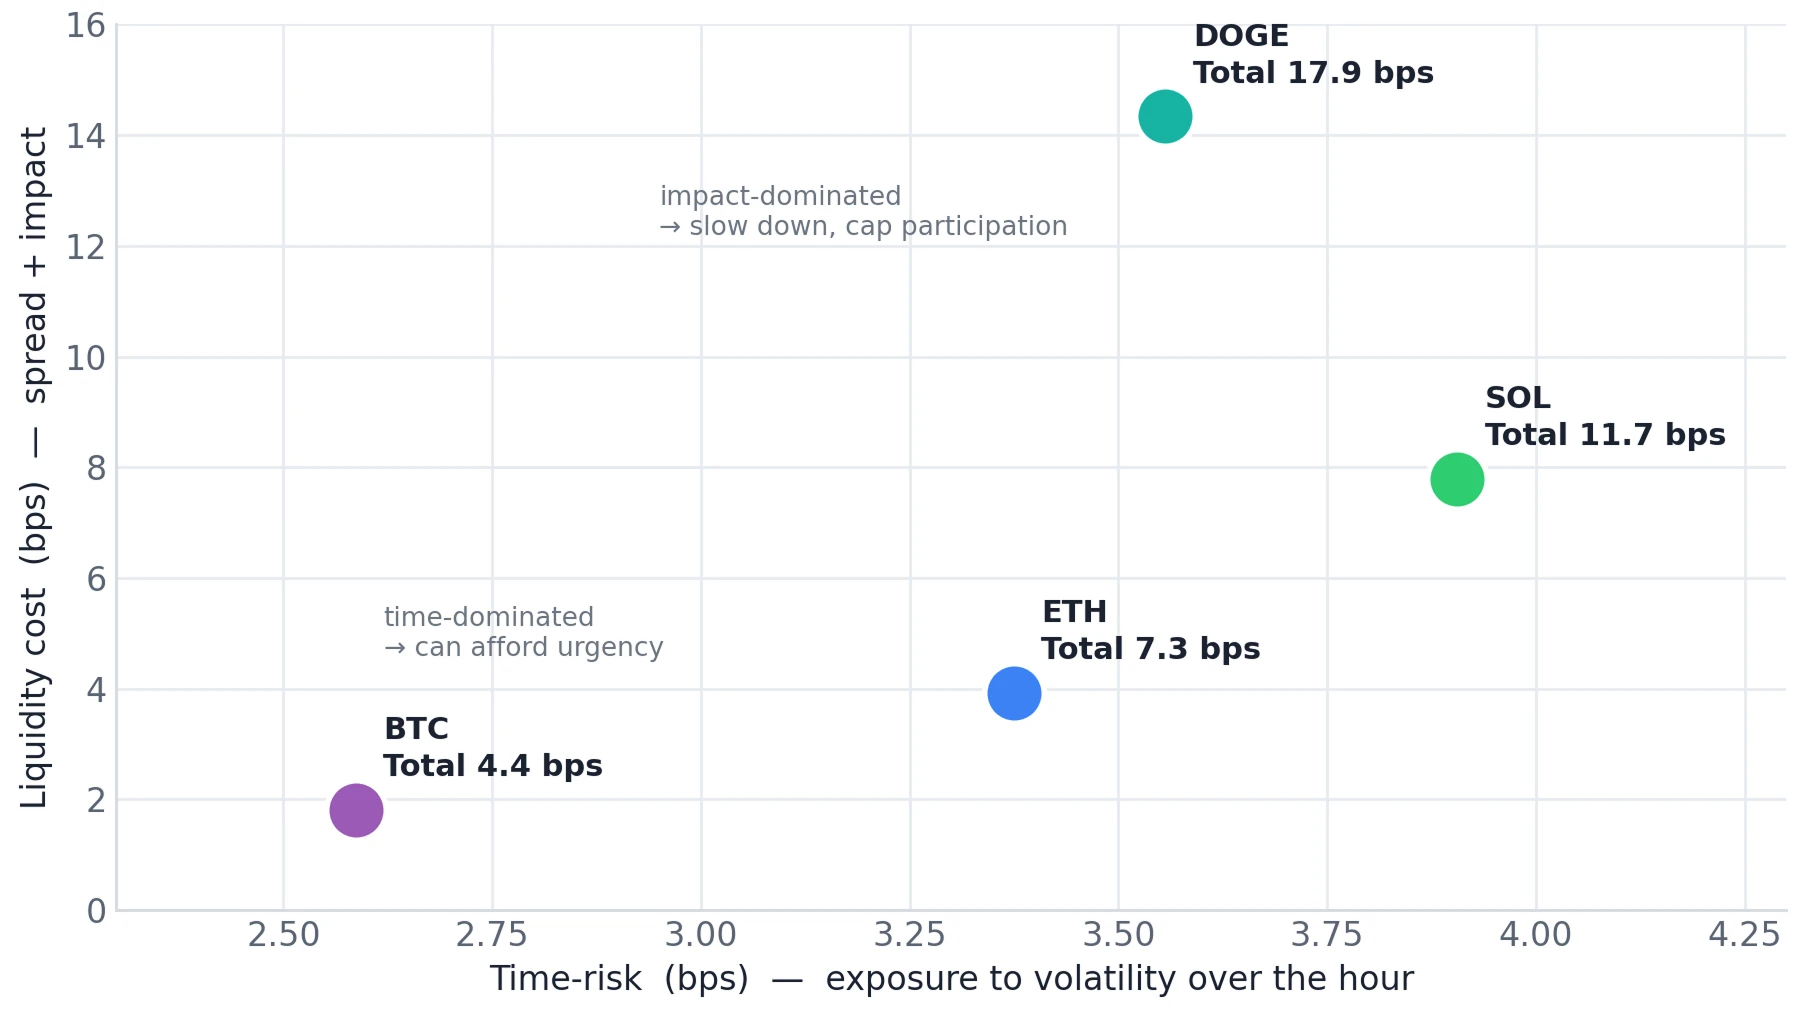
BTC sits low and to the left: relatively cheap to execute, with time the main consideration — a trader could afford to be execute faster (more urgent). DOGE sits high: impact dominates, and the sensible response is the opposite: lengthen the schedule, cap participation, accept more time in the market to spare the book. SOL is the instructive middle case, carrying a meaningful charge on both levers at once; neither alone tells the full story.
There is no universal “right” duration, algorithm or speed. The optimal choice is specific to the asset, the size and the moment. Only a calibrated, pre-trade view reveals which lever you are actually fighting.
Why Crypto Makes Execution Discipline Essential
Digital asset markets place greater demands on execution discipline than equities. Digital assets trade 24/7, with no closing auction to anchor a fair price. Liquidity is fragmented across more venues than any other mature asset class, each with its own depth, fees and toxicity. The execution surface is far richer than a single lit order book. Passive, typical exchange maker fills can cost next to nothing (0-1 bps), while crossing the spread as a taker may cost 3-5 bps. Private liquidity providers stream an all-in price you can only take, with typically no book to rest a passive order. Decentralised venues and AMMs discover prices differently still. Layer on the differences by product – spot, perpetuals and options, each with its own microstructure – and the number of viable ways to work a single order becomes large.
Complexity Fit for an Agent
A typical trader is unlikely to check more than a few single digit pre-trade scenarios in a “click and view” (UI) style of interaction. A systematic trader runs programmatic scenarios via an API that is rooted in pre-defined rules that may not be applicable for the creative trader, who at times can’t predict what he’ll want or need to trade next.
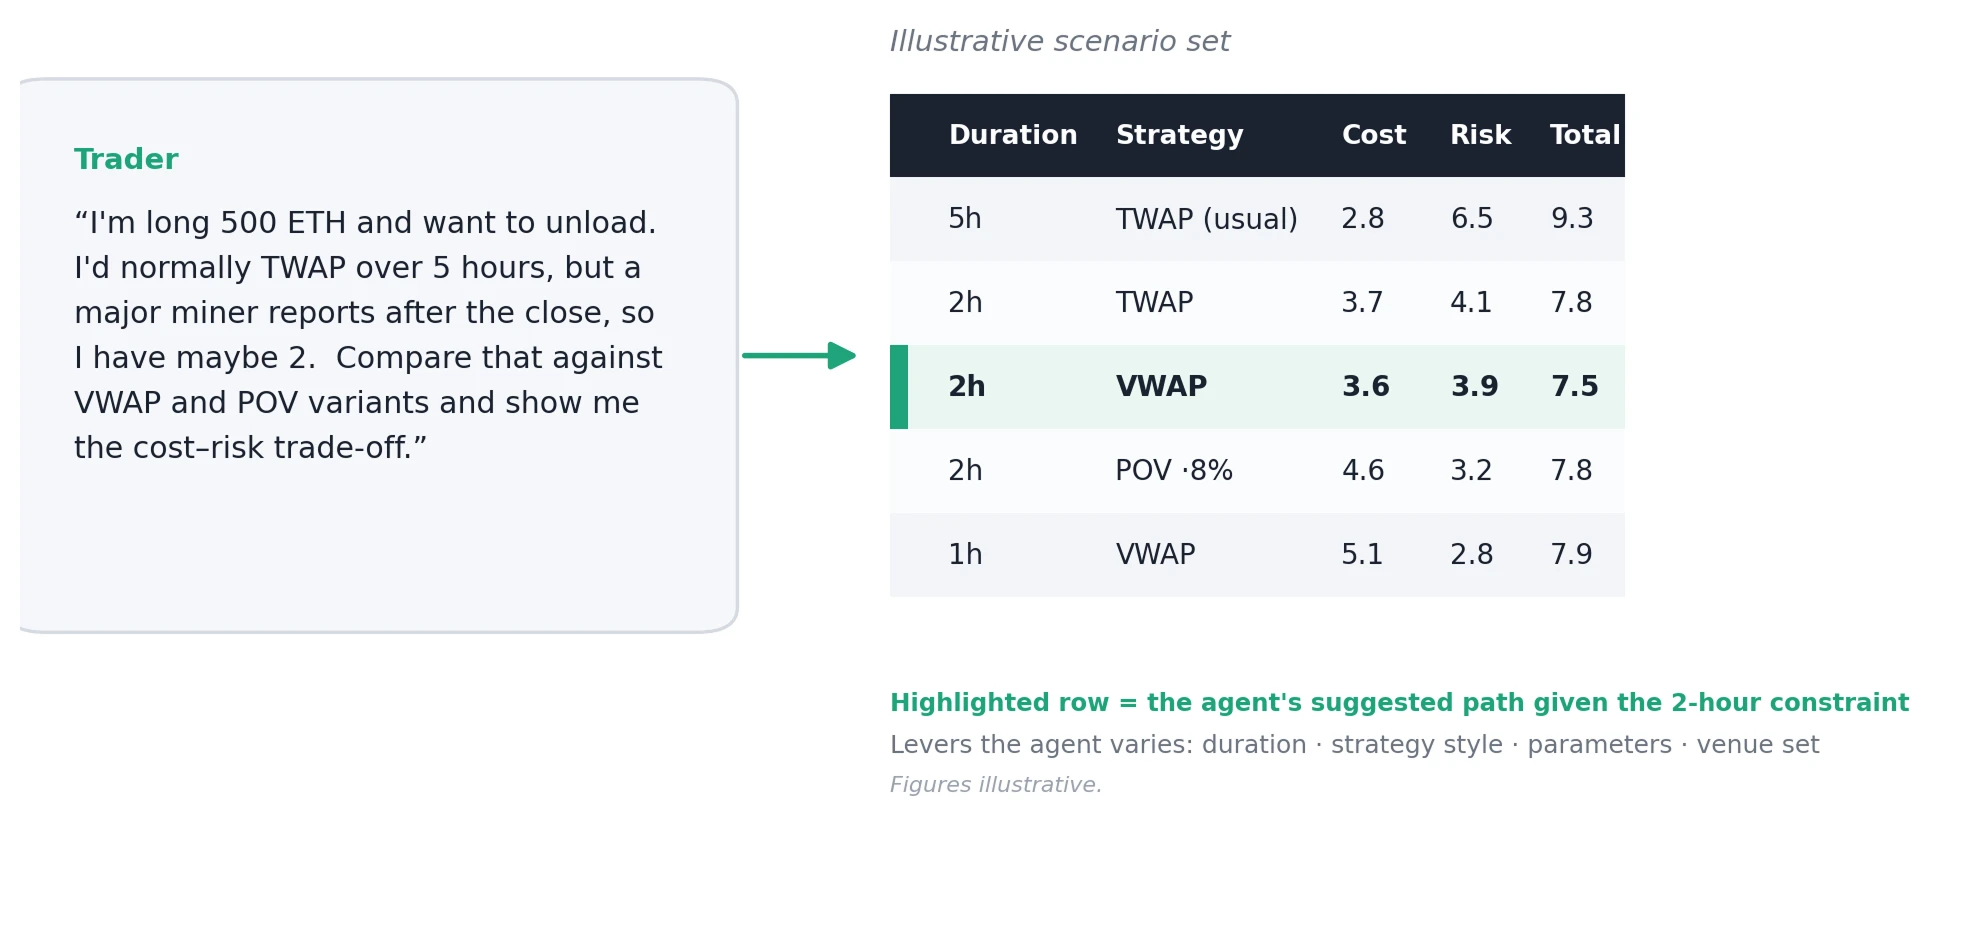
Imagine simply saying: “I wish to unwind my 500 ETH long position. I'd normally TWAP over 5 hours, but a major miner reports after equities close, so I have maybe 2 hours to trade. Compare VWAP, TWAP and Sniper algo variants, and show me the cost-risk trade-off with your conviction.” A capable agent knows which levers are worth varying: duration, strategy style, the parameters within each strategy, and returns a sensible spectrum of scenarios to weigh. Voice is a natural medium for navigating this much complexity. Figure 3 illustrates how such a hypothetical exchange might look. While this example is hypothetical, we expect traders will develop and begin to use agents like this in the future.
Figure 3 – From question to scenarios: a hypothetical pre-trade agent. A plain-language request becomes a cost scenario spectrum. The agent is advisory: the trader always executes. For illustrative purposes only; not actual data.
The Multi-Asset Horizon
This matters well beyond crypto. As equities, commodities, money markets and fixed income move on-chain, price discovery will fragment further across jurisdictions, regulated trading hours and 24/7 venues, on-exchange books and off-market blocks. Expressing a view will increasingly mean planning execution: pricing the impact of taking a block on risk during off-hours and everything in between.
Pre-trade analysis is the minimum bar for operating in that multi-asset environment. A natural-language agent that can reason across fragmented liquidity sources, time of day, and the universe of feasible strategy parameters will be an intuitive way to manage the complexity. The infrastructure to support both exists today. The direction of travel is agentic and AI-driven, so that traders can increasingly focus on what to trade, and less on how to trade.
Disclaimer: The information herein is provided for informational purposes only. Talos Trading, LLC and its affiliates (“Talos”) make no representations or warranties as to its accuracy or completeness. Nothing herein constitutes an offer to buy or sell, or a recommendation of, any digital asset, security, derivative or trading strategy, nor investment advice. Any references to execution approaches, schedule durations, or participation rate strategies are illustrative of model outputs and do not constitute execution or trading advice. Figures in the agentic illustration are for illustrative purposes only.
Reprinted from CfC St. Moritz - Before the First Fill: Quantitative Pre-Trade Analytics and the Agentic Future of Digital and Multi-Asset Execution
Latest insights and research


Request a demo
Find out how Talos can simplify the way you interact with the digital asset markets.