

Beneath the Trillions: What’s Driving USDC and USDT Transfer Volume?
State of the Network #376
Beneath the Trillions: What’s Driving USDC and USDT Transfer Volume?

Introduction
State of the Network #376
Coin Metrics State of the Network is an unbiased, weekly view of the crypto market informed by our own network (on-chain) and market data.
Key Takeaways:
- Each dollar of USDC supply turns over 741x on an annualized basis, ten times USDT’s 74x, despite USDT having a market cap more than $100 billion larger.
- USDC’s high turnover is driven by flashloans and liquidity-pool activity, which account for most volume on Base and Ethereum, while USDT on Tron is more closely tied to exchange flows.
- Stablecoin transfer volume today is largely driven by the plumbing of crypto markets, including liquidity management and exchange settlement, while payments and commercial use cases continue to develop.
Introduction
Stablecoins have evolved beyond trading instruments into the backbone of onchain liquidity, offering a global, 24/7 means to store, transfer, and settle value on blockchains. Since 2025, onchain stablecoin settlement has decoupled from crypto trading volumes. Adjusted onchain transfer volume has exceeded $250B per day at points this year, while exchange trading volume has fallen to roughly $18B per day.
In 2026 so far, stablecoins have settled $41.7T in adjusted transfer volume. Despite the recent deceleration in stablecoin supply, each dollar of stablecoin supply is turning over more frequently than in prior years. This reflects a broadening range of uses, from exchange liquidity management and DeFi collateral movement to emerging consumer and B2B payment flows.
In this issue of State of the Network, we look beneath the trillions in stablecoin transfer volume to examine USDC and USDT’s velocity, and trace what’s driving record volumes across their largest networks. Building on our previous analysis, “The Curious Case of USDC on Base,” which found that roughly 50% of USDC’s transfer volume on the Base L2 traces to DeFi infrastructure (DEX liquidity provision and flashloan activity), we conduct a bottoms-up analysis of USDC and USDT transfer volume across Ethereum, Base, and Tron.
Supply vs Velocity: Comparing Stablecoin Turnover
While supply measures the size of a stablecoin’s monetary base, velocity tells you how frequently that supply moves onchain. Together, they provide a view of whether a stablecoin is functioning as an active asset or sitting idle as a store of value. This very distinction has been central to the CLARITY Act, which permits rewards tied to genuine transactional activity while discouraging yield simply for holding a balance.
By that measure, USDC looks like the clear winner. The chart below compares stablecoins across these two dimensions in 2026 so far: supply and velocity. USDC’s annualized (adjusted supply) velocity of 741x is ten times higher than USDT’s 74x, despite USDT commanding a market cap over $100B larger. This indicates that, relative to circulating supply, USDC is transferred far more frequently than USDT.
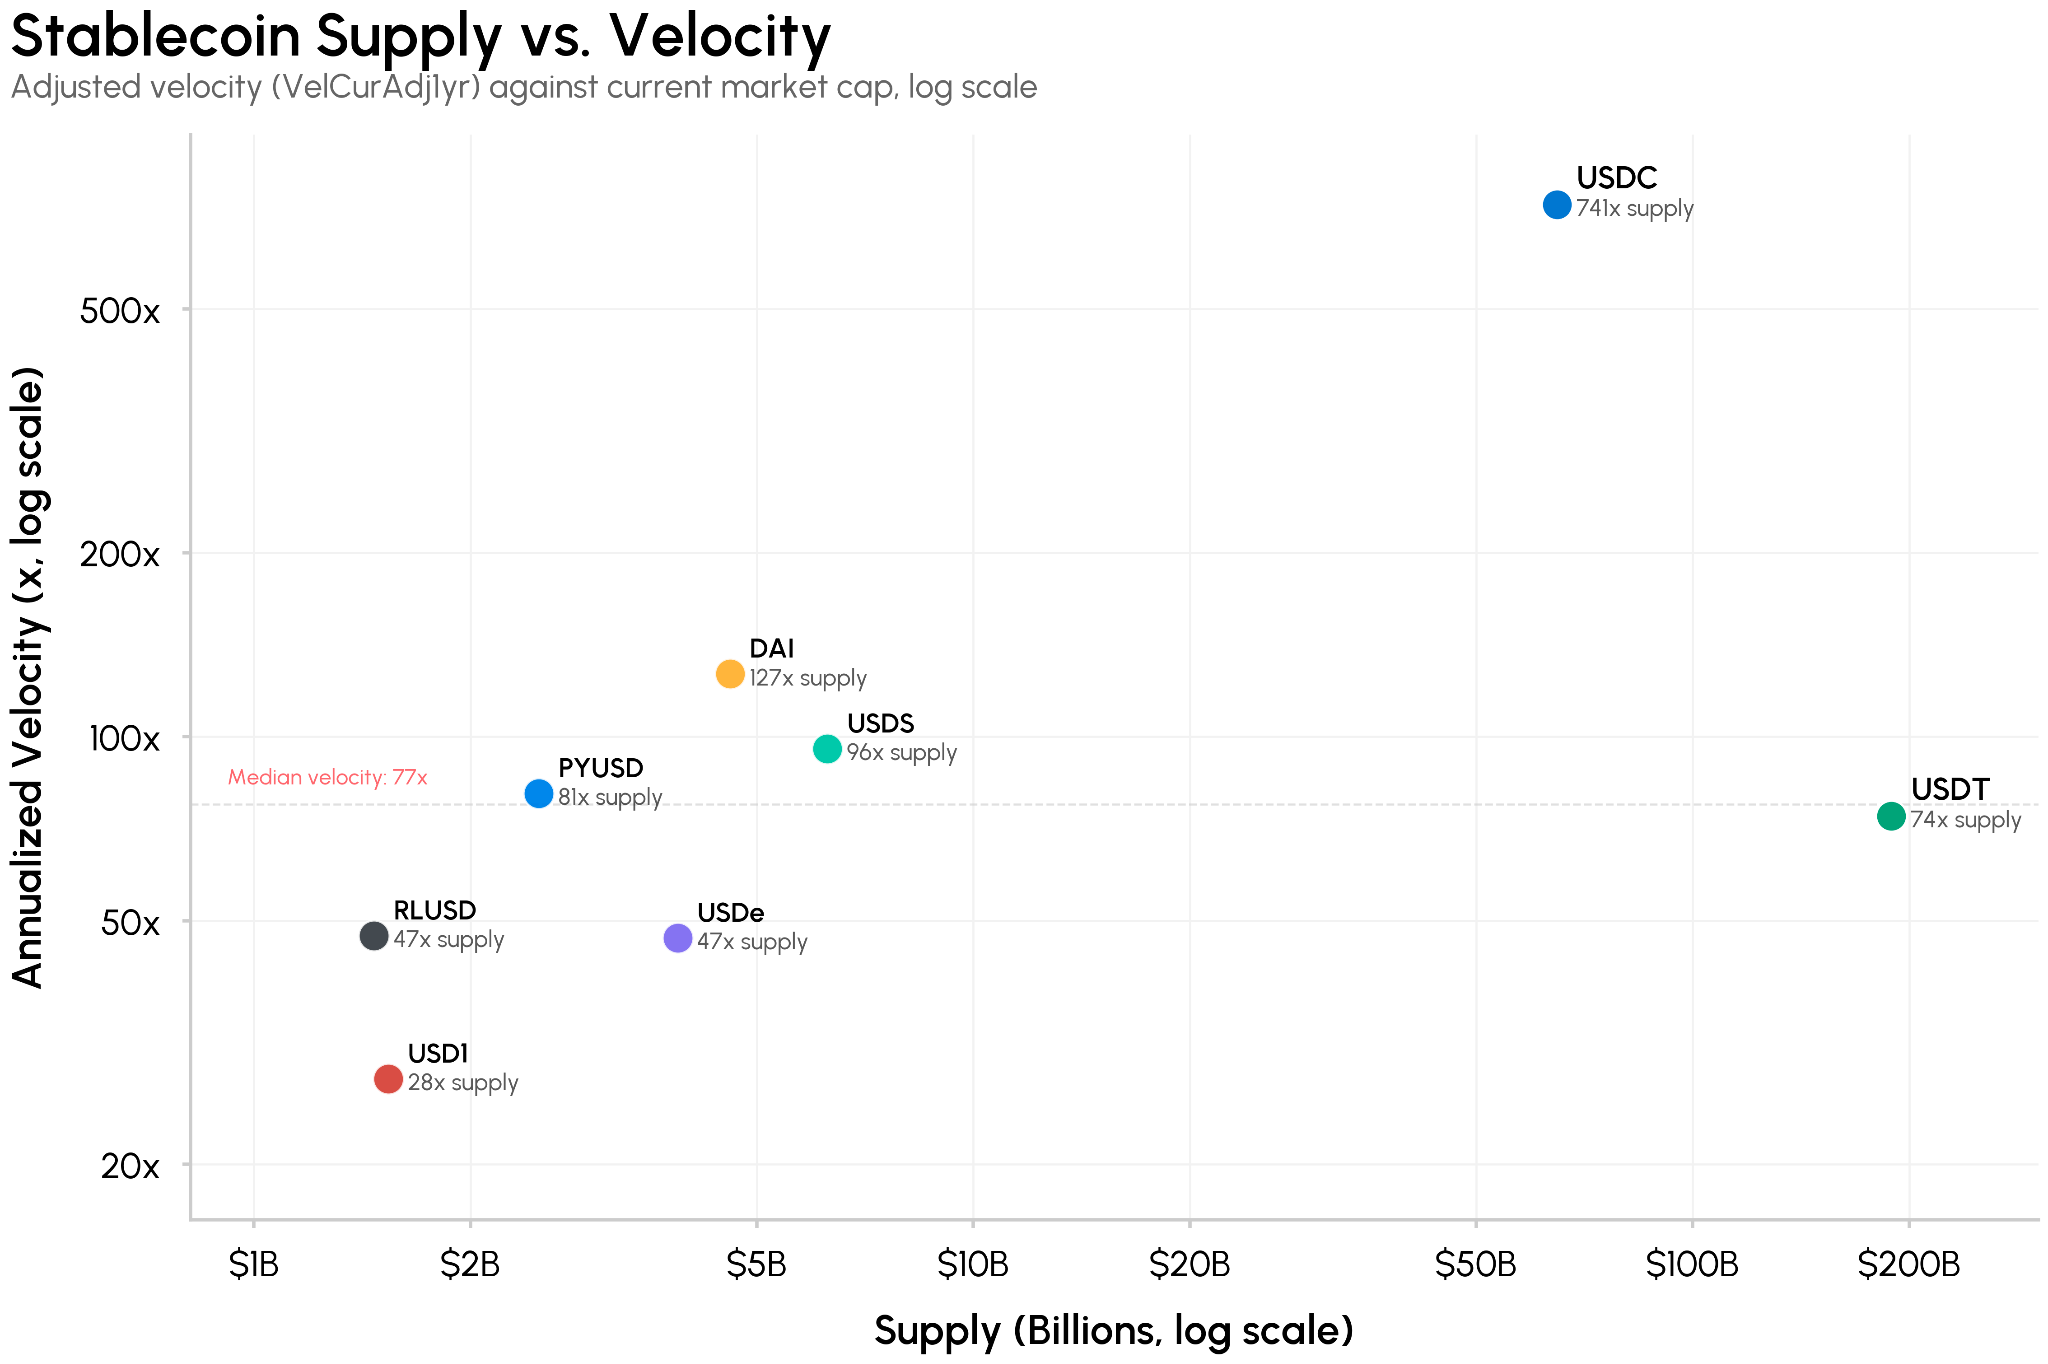
Source: Talos Network Data Pro
The GENIUS Act’s passage in 2025 gave USDC a regulatory tailwind reinforcing its network effects in onshore U.S.regulated markets, decentralized finance (DeFi), and institutional settlement. USDT’s dominance by contrast is a result of its first mover advantage, offshore emerging-markets usage, and affinity to Tron, where dollar access and remittance flows matter more.
Circle’s USDC overtook Tether’s USDT in adjusted transfer volume in 2024, with the lead only widening this year. As of August 2026, USDC has settled $32T in transfer volume, 77% of the stablecoin market while USDT settled $8T (19%). While USDC continues to lead, the gap has narrowed with USDC now back to under $100B in daily transfer volume.
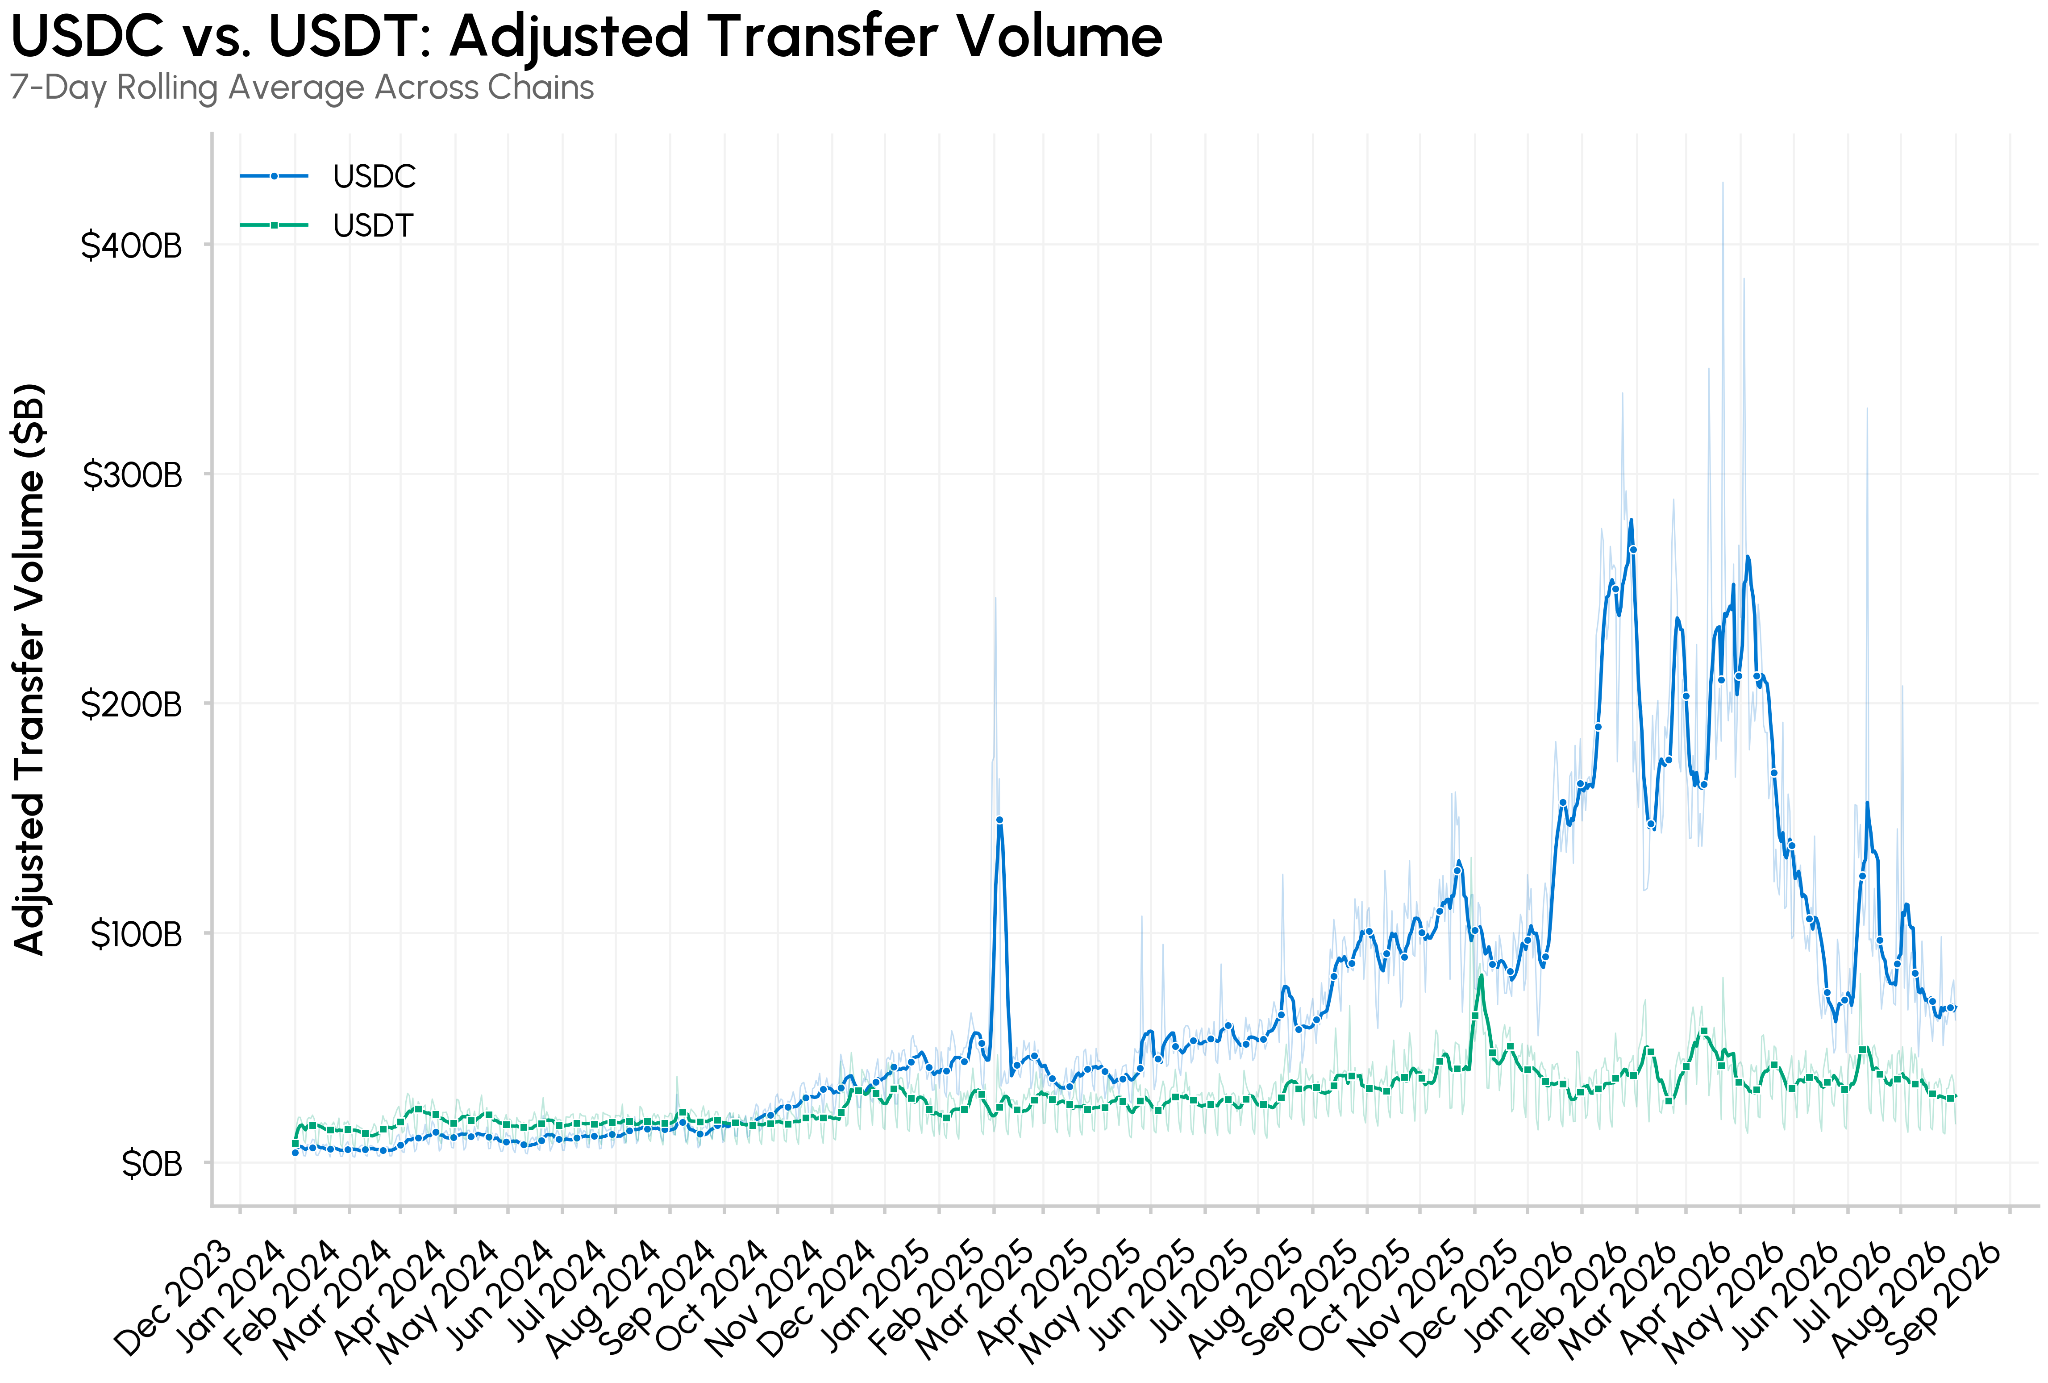
Source: Talos Network Data Pro
According to Circle’s Q2 2026 Earnings, USDC’s onchain transaction volume grew 151% YoY in Q2 2026 to $14.8T, while circulating supply grew at a much slower rate. Reserve income, rather than transaction activity, still made up roughly 95% of that revenue. Circle’s own Layer-1 blockchain, Arc, is one of its lanes to transaction-based revenue, which makes the drivers of USDC’s transaction volume an important question.
In the sections below, we break down transaction volume across USDC (on Ethereum and Base) and USDT (on Ethereum and Tron), which covers the vast majority of all stablecoin transfer volume.
Decomposing USDC and USDT Transfer Volume
To find out what’s driving these astounding numbers, we took a bottoms-up approach building on our prior analysis of USDC on Base. For each stablecoin and chain, we identified the contracts most likely to generate mechanical volume: the primary lending markets used for flashloans, the largest liquidity pools on each chain’s dominant DEX, and known exchange wallets. Together, these map to three categories: flashloans, DEX liquidity provision, and exchange (CEX) flows.
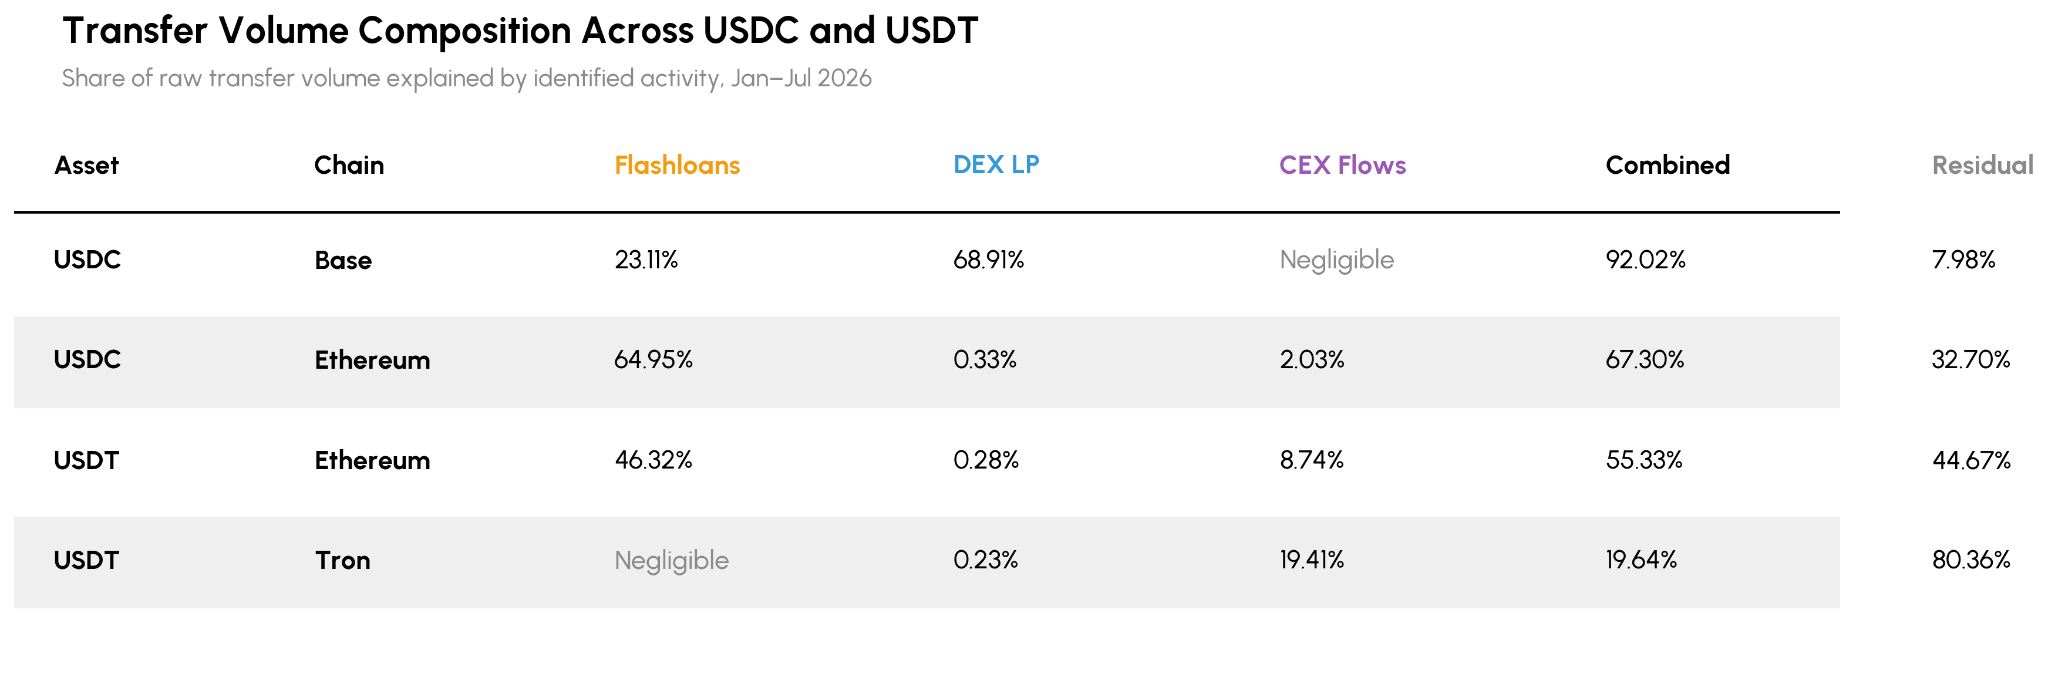
We then measured the share of each chain’s total raw transfer volume that flowed through those categories, using Talos’ unadjusted transfer volume metric. The tagged categories should be viewed as lower-bound estimates with the remainder including activity that was not isolated, including potential payments, bridging, treasury movements, and other forms of settlement.
USDC on Base
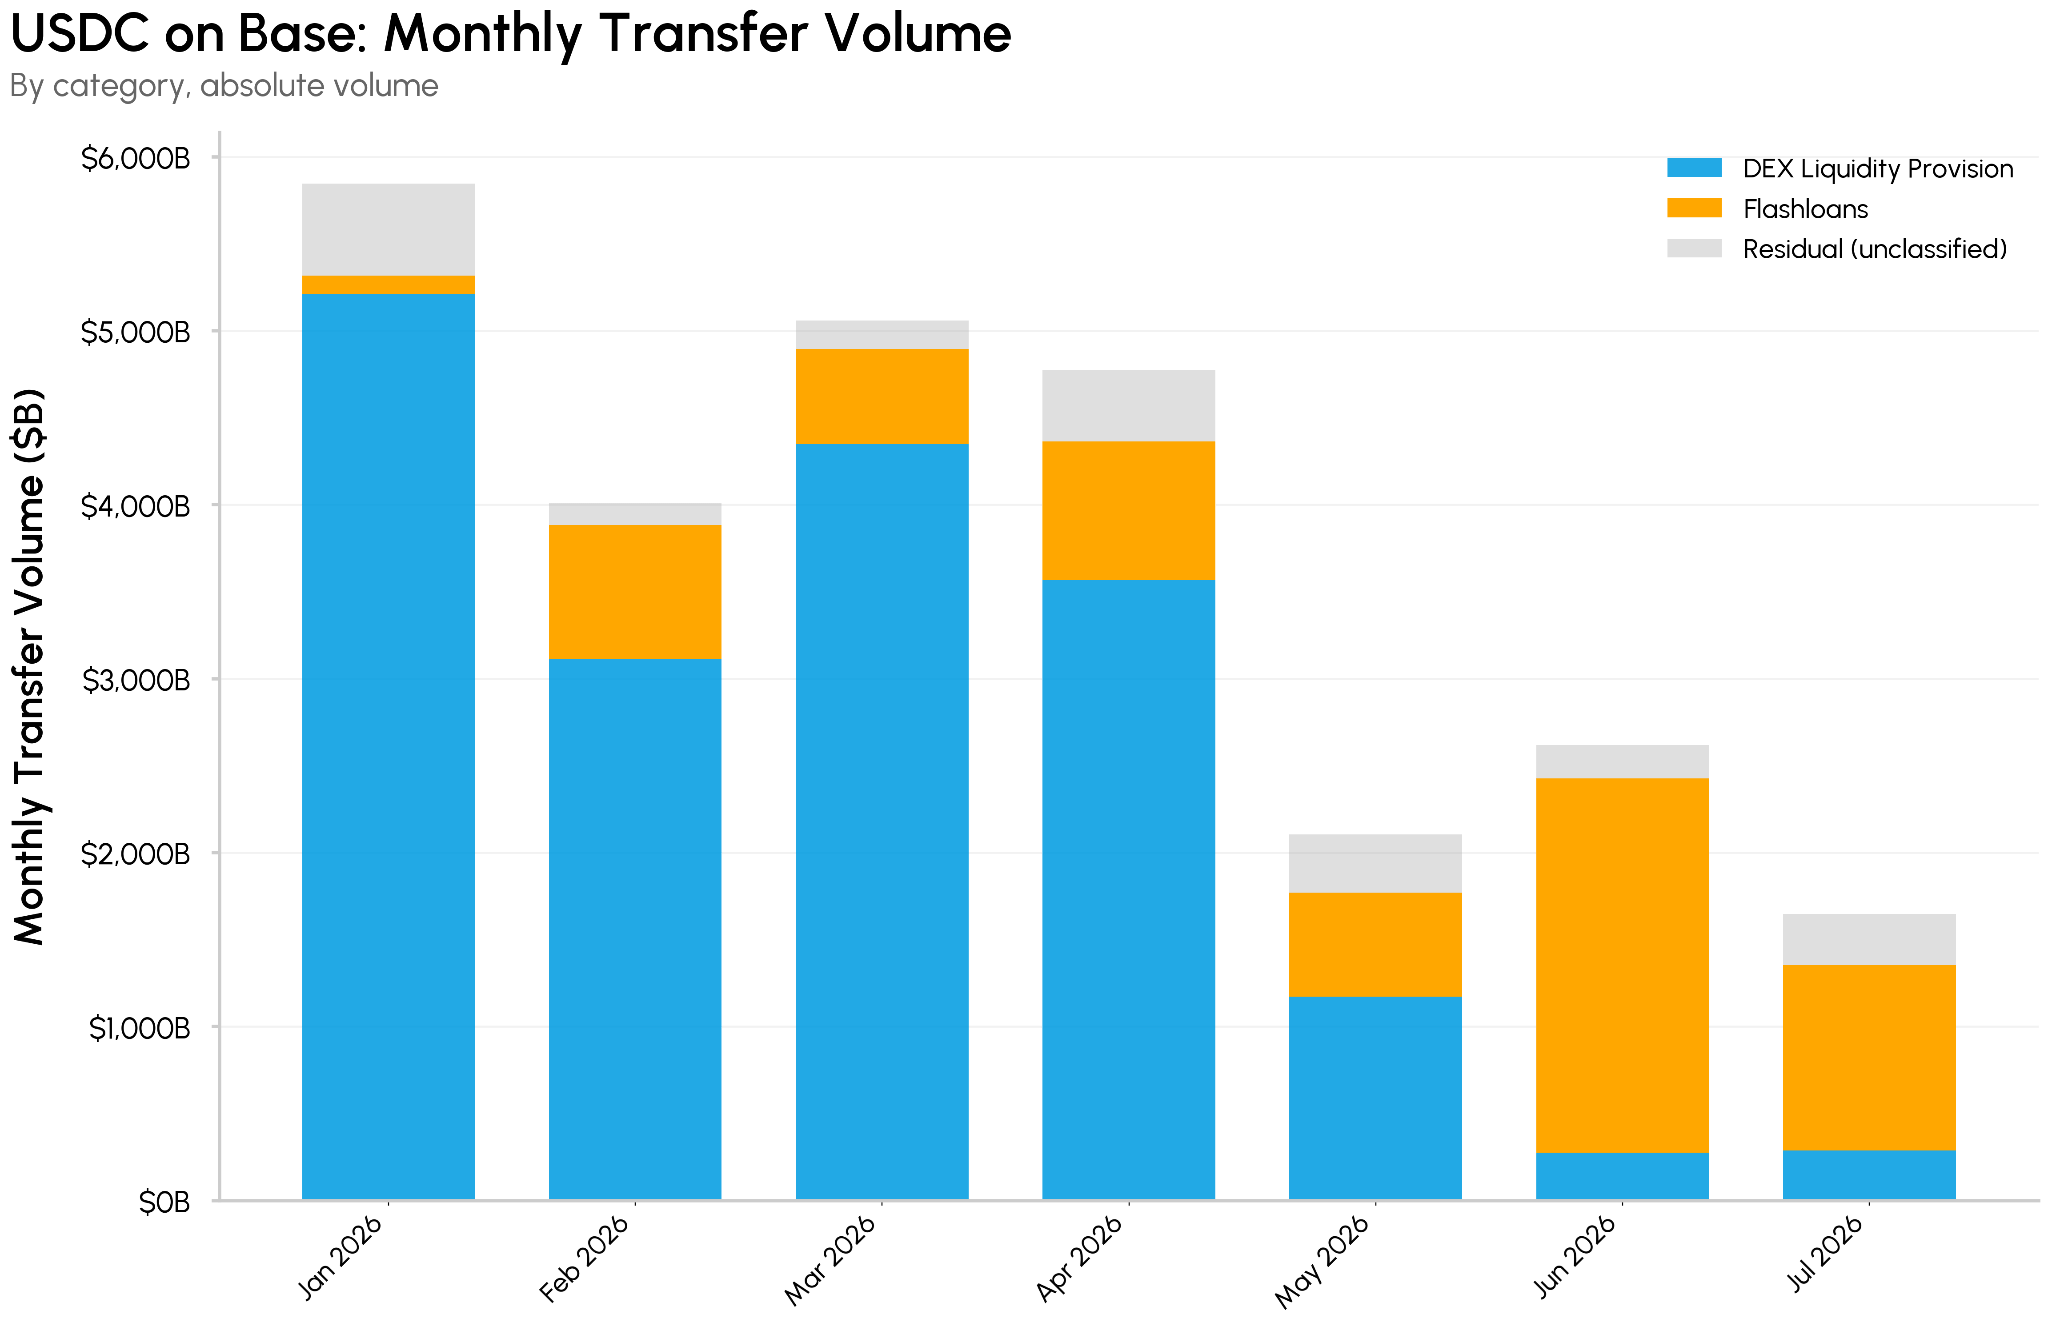
Coinbase’s L2 Base accounted for 67% of USDC transfer volume in 2026. Activity was highly concentrated: more than 90% of Base USDC volume traced to just three contracts. DEX liquidity provision on Aerodrome accounted for the largest share of volume over the full period, while flashloan activity through Morpho became more prominent later in the year. A single day in June saw flashloan volume exceed $500B. Base’s low fees and deep USDC liquidity make high-frequency, automated activity economical at scale.
- Flashloans, 23%: bots borrowing and repaying uncollateralized loans within a single transaction, through Morpho’s singleton contract (which every isolated lending market routes through), to capture arbitrage opportunities
- DEX liquidity provision, 69%: automated strategies continuously rebalancing liquidity across two Aerodrome pools as prices shift, generating enormous gross volume while barely shifting net capital
- Residual, ~8% : Activity outside the tagged flashloan and liquidity-pool contracts.
USDC on Ethereum
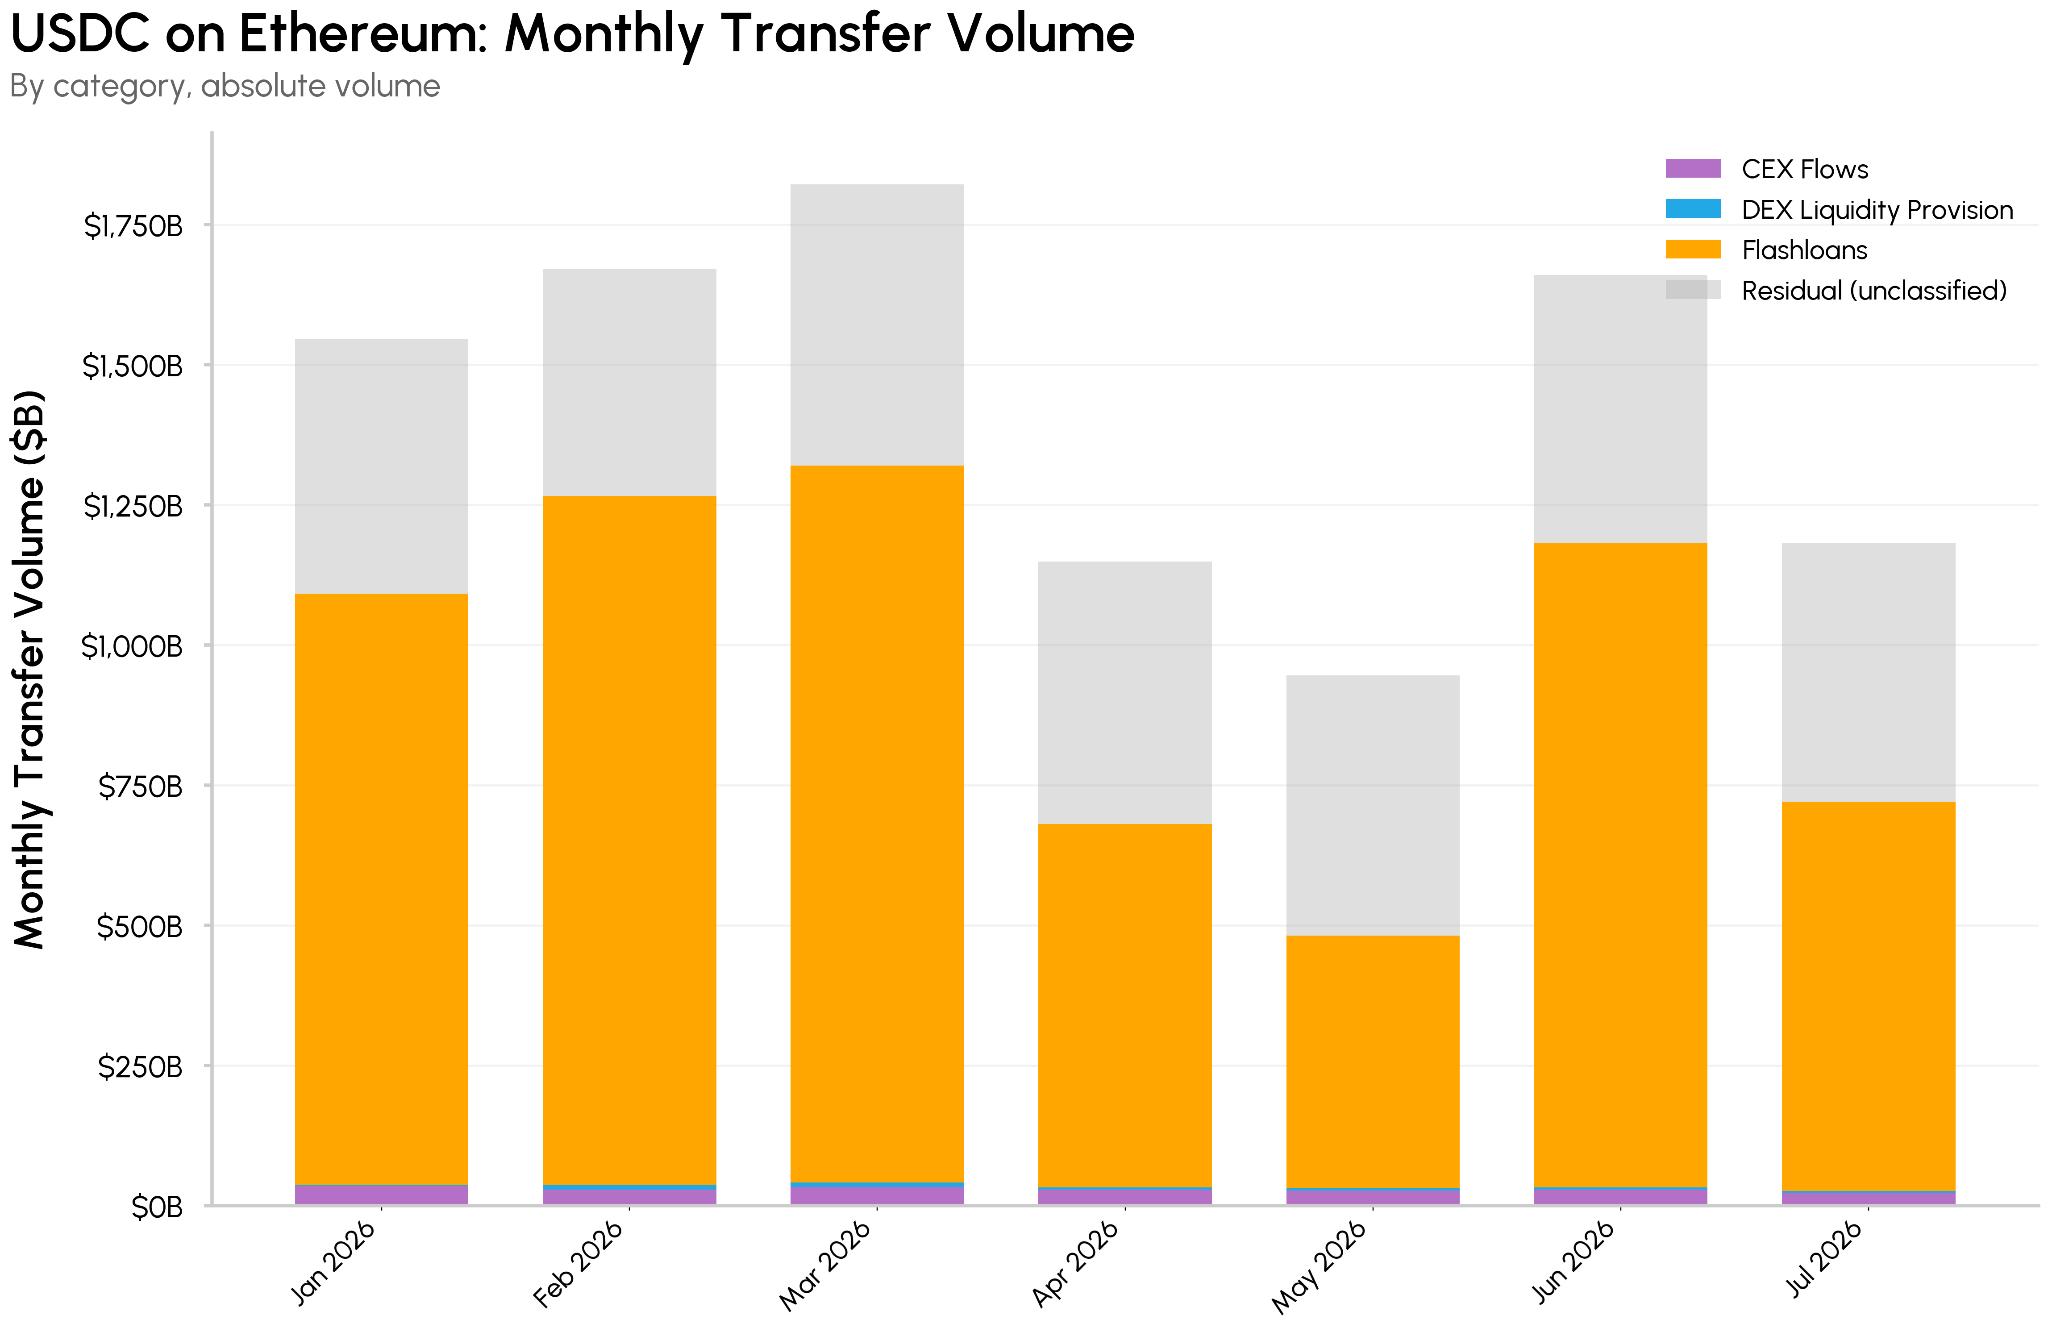
USDC activity on Ethereum is even more concentrated in flashloans, which account for 65% of transfer volume, nearly three times their share on Base. Ethereum’s deep USDC liquidity and large lending markets make it a natural venue for large-scale flashloans and arbitrage, while higher fees limit the constant rebalancing activity seen on lower-cost chains such as Base.
- Flashloans, 65%
- DEX liquidity provision, 0.3%
- CEX flows, 2%
- Residual, ~33%
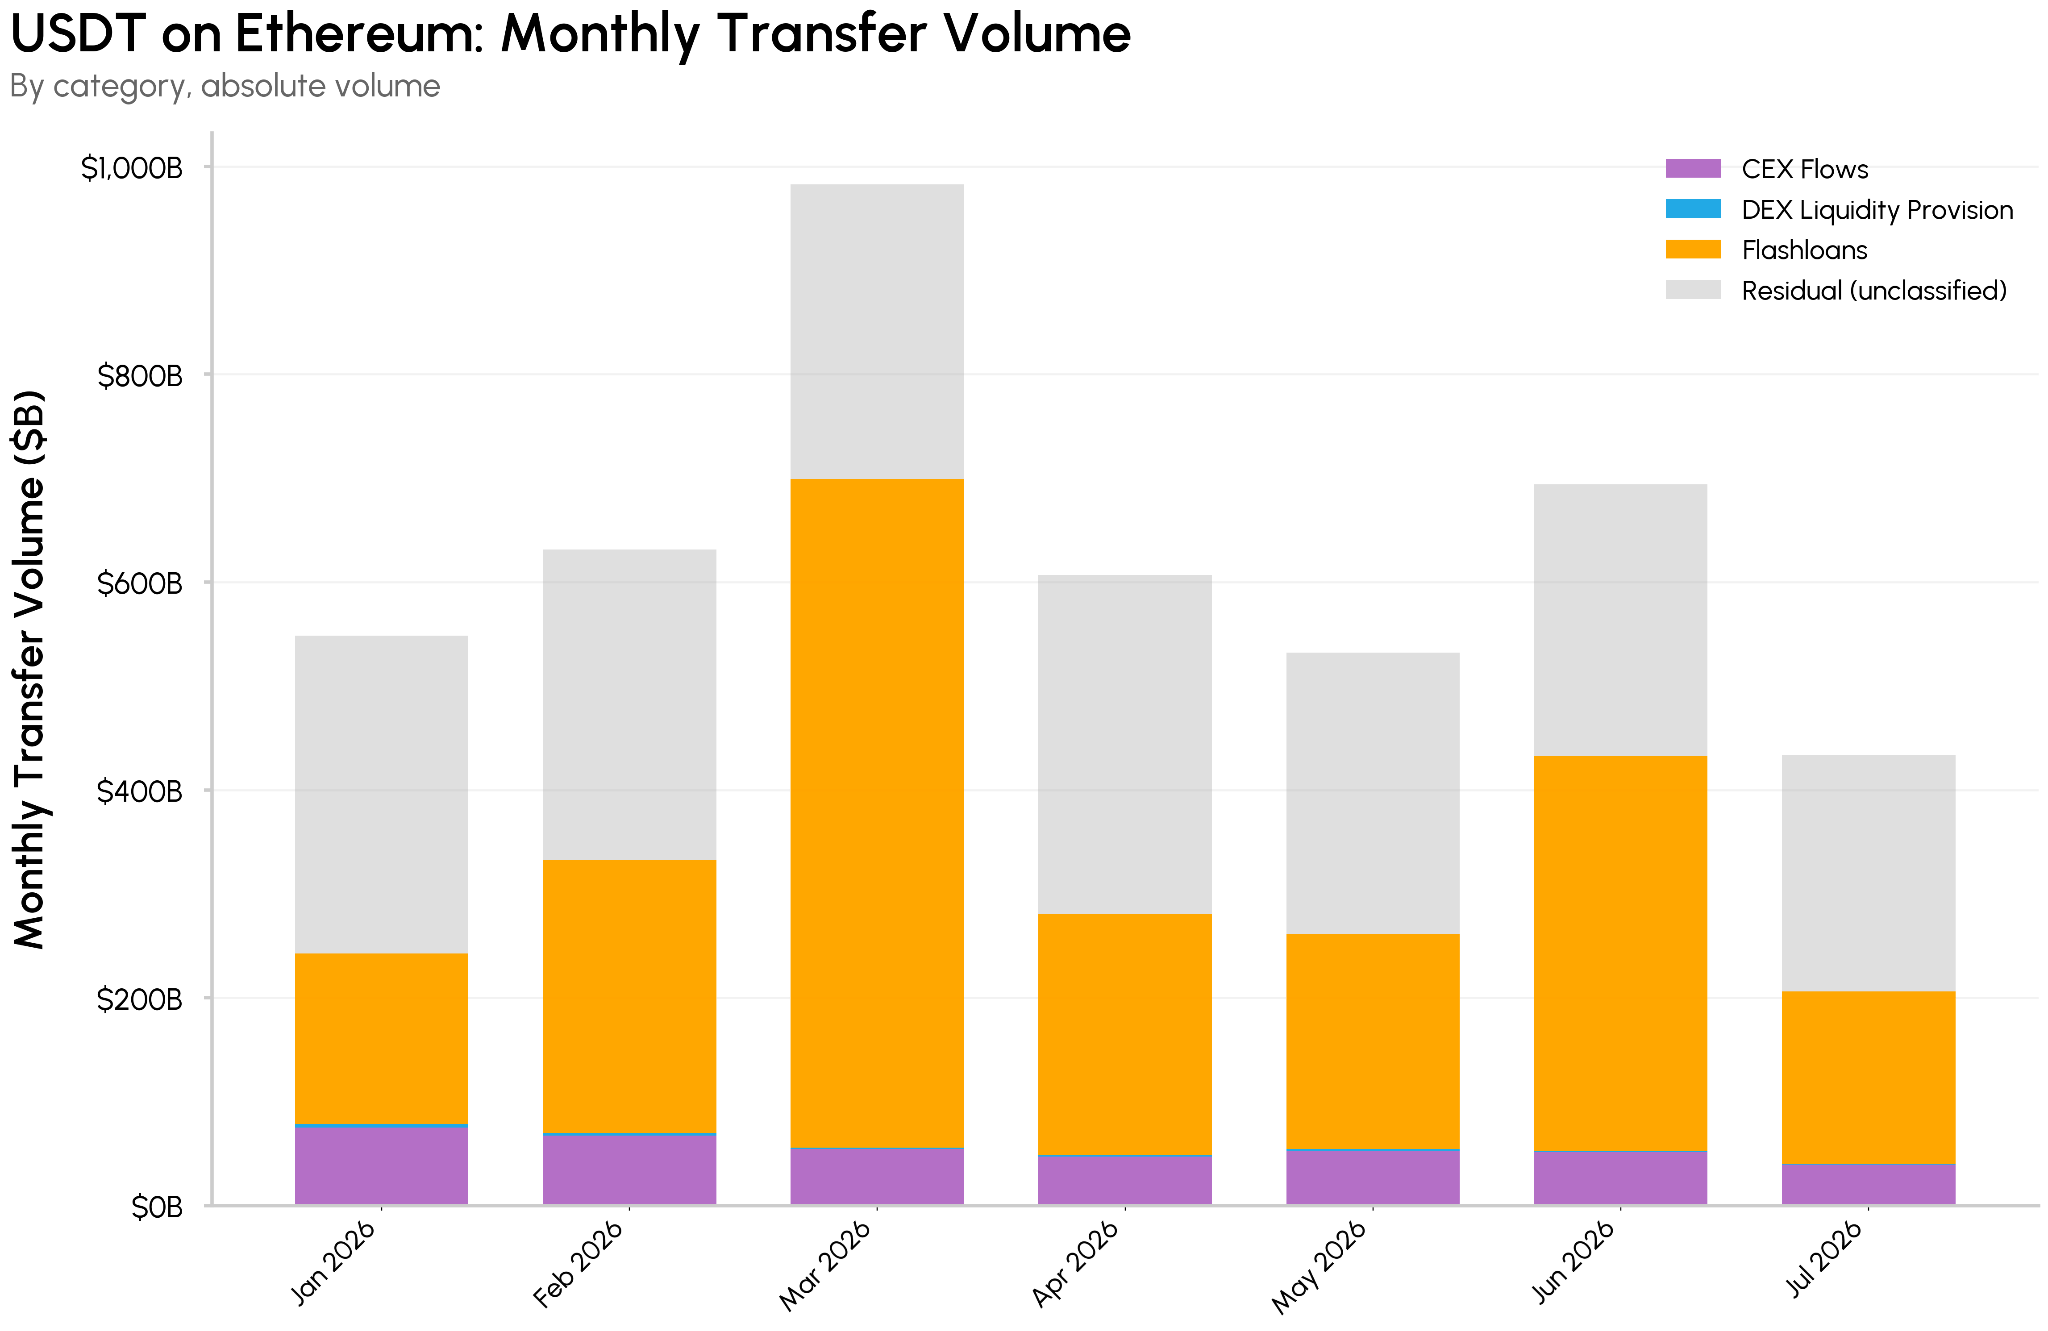
USDT on Ethereum
Flashloans also account for a significant share of USDT volume on Ethereum, though less than for USDC. CEX flows are more prominent, consistent with USDT’s broad role in exchange-related liquidity and settlement.
- Flashloans 46%
- DEX liquidity provision, 0.3%: primarily through Uniswap V3’s USDT/WETH pool
- CEX flows, 9%: deposits and withdrawals across 30 centralized exchange (CEX) wallets
- Residual, ~45%
USDT on Tron
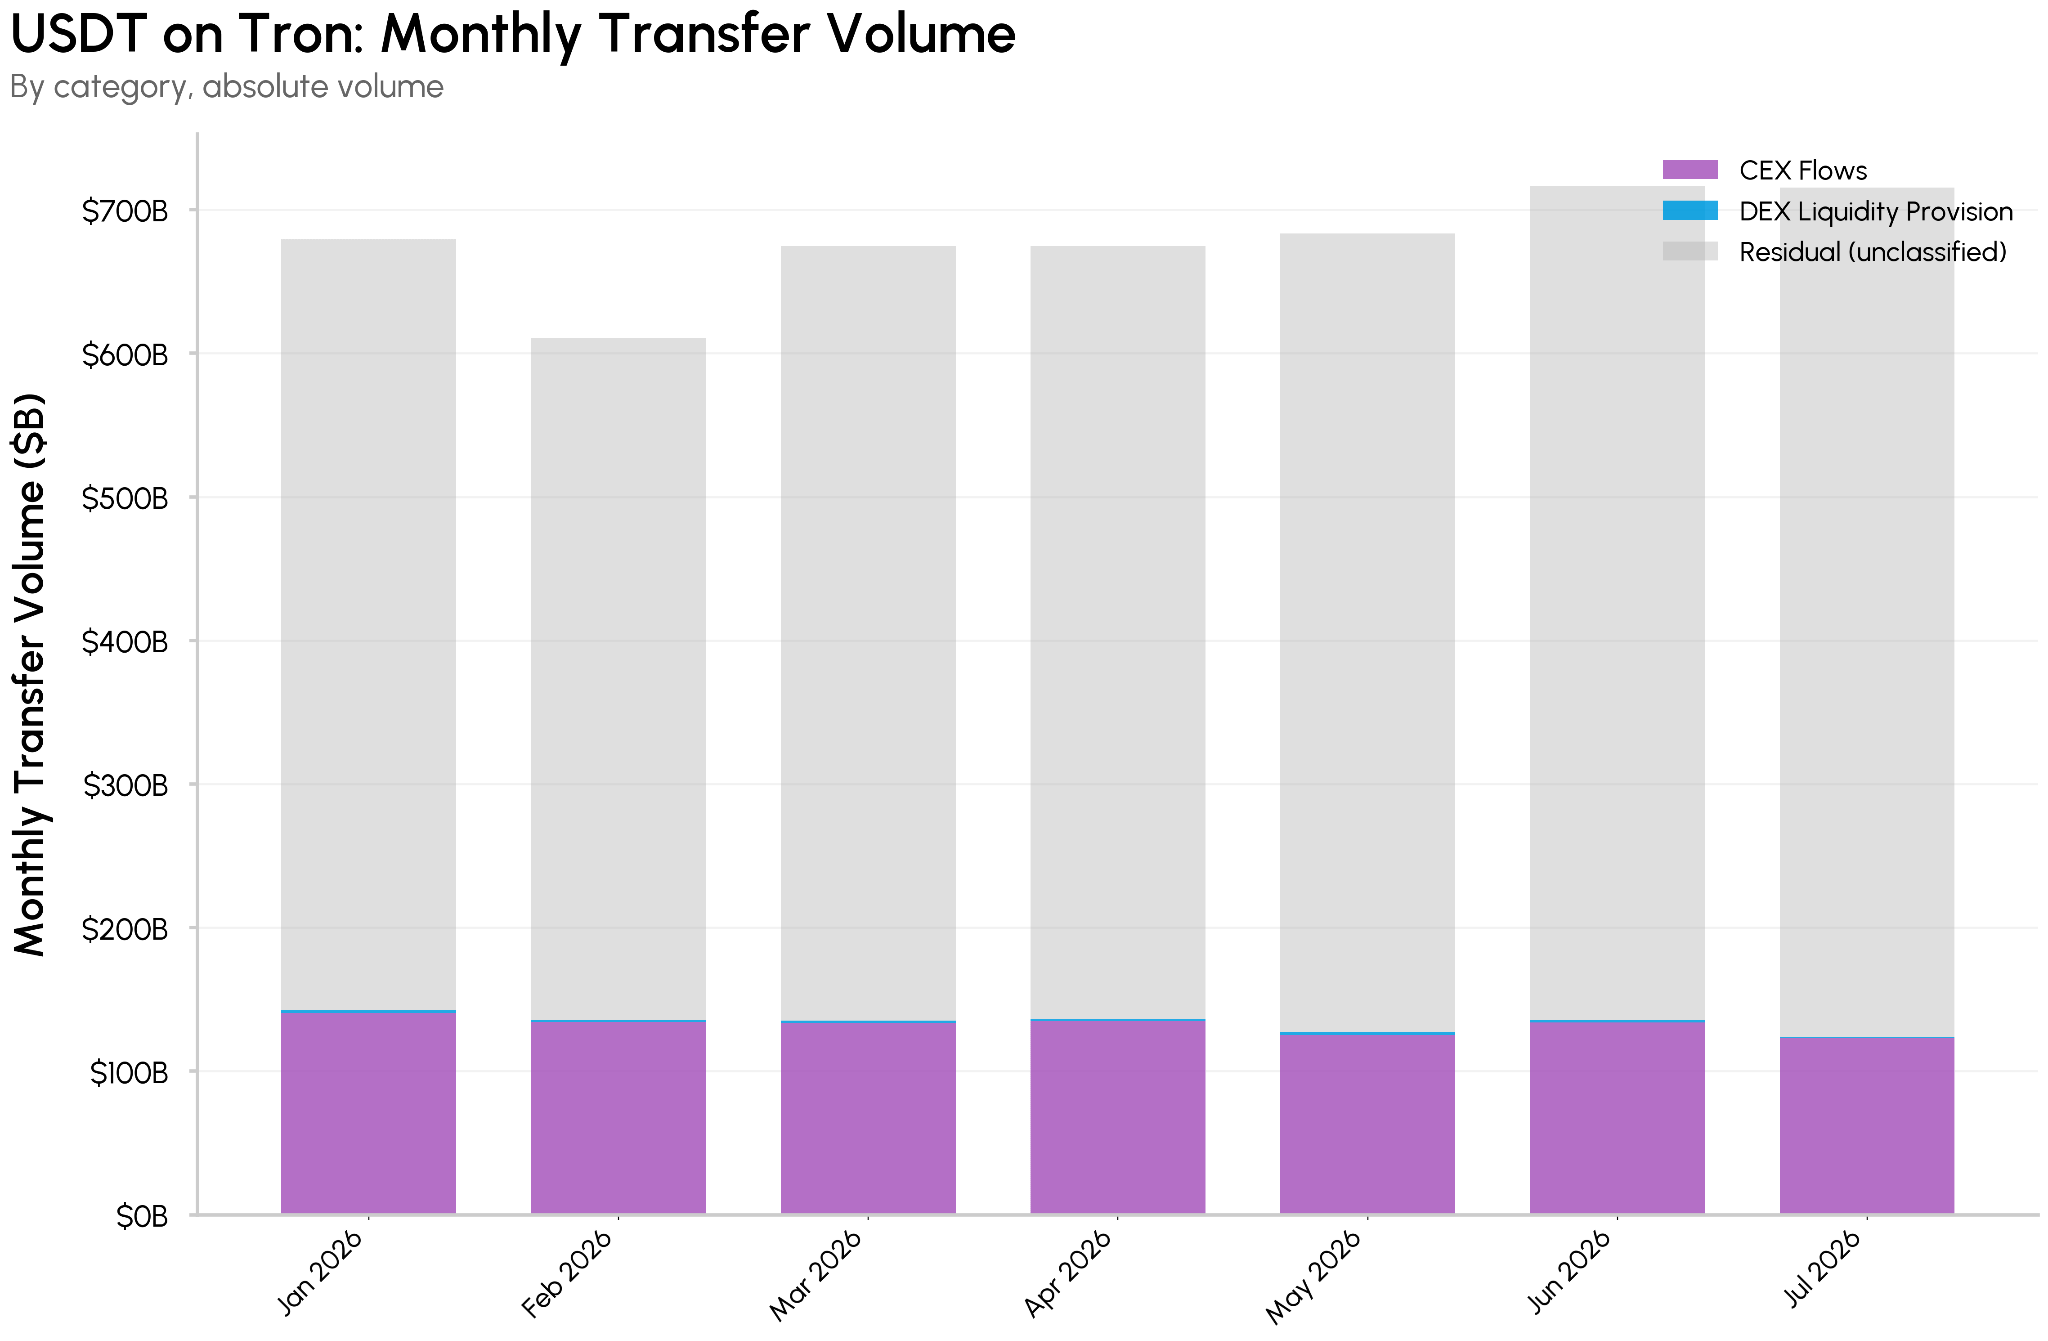
USDT activity on Tron follows a different, more consistent pattern of usage. Flashloan and DEX liquidity activity, which explain a substantial share of USDC and Ethereum USDT volume, are almost absent. CEX flows are the largest identified category, reflecting Tron’s role as a low-cost settlement rail for exchange deposits and withdrawals. The remaining 80% is the highest of any chain analyzed, and may include payments, remittances, and other unclassified activity.
- Flashloans: negligible. Lending protocols like JustLend showed no meaningful volume.
- DEX liquidity provision, 0.2%: across four Sunswap pools
- CEX flows, 19%: deposits and withdrawals across 33 confirmed exchange wallets, spanning Binance, OKX, Bybit, and other primarily offshore exchanges
- Residual, ~80%
The breakdown highlights distinct stablecoin market structures across chains: USDC volume on Base and Ethereum is largely tied to flashloans and liquidity activity, USDT on Ethereum has a more mixed flashloan and exchange-flow profile, and USDT on Tron has little identified DeFi activity alongside the largest residual share.
Source: Talos CM ATLAS and Talos Network Data Pro
Conclusion
Stablecoin transfer volume has reached meaningful scale, frequently drawing comparisons to the largest payments networks. Today, much of that volume reflects the movement of liquidity through crypto markets: liquidity is deployed and rebalanced, arbitrage is executed, and capital is settled across exchanges and protocols. These are real and valuable uses of stablecoins, helping make digital asset markets more liquid, efficient, and globally accessible.
At the same time, headline transfer volume should not yet be read as equivalent to consumer payments or real-world economic activity. Stablecoins are increasingly used as a settlement layer for digital asset markets, while payment, remittance, and B2B use cases are still developing alongside it. Going forward, the quality of stablecoin transfer volume will matter as much as its scale, as differences in supply and velocity reveal how stablecoin liquidity is deployed across crypto markets.
Subscribe and Past Issues
Coin Metrics State of the Network is an unbiased, weekly view of the crypto market informed by our own network (on-chain) and market data.
If you’d like to get State of the Network in your inbox, please subscribe here. You can see previous issues of State of the Network here.
Disclaimer: The information herein is provided for informational purposes only. Talos Trading, LLC and its affiliates (“Talos”) does not give any representations or warranties in relation to the accuracy, validity, or completeness of the information of this material, including without limitation the factual information obtained from publicly available sources considered by Talos to be reliable at the time. Talos accepts no liability for any consequences of using the information contained in this material. Any opinions or estimates expressed herein reflect a judgment made by the author(s) as of the date of publication and are subject to change without notice. Neither this material nor any copy thereof may be taken, reproduced, or redistributed, directly or indirectly, without Talos’s prior written permission. Any views or opinions expressed are those of the authors and do not necessarily reflect the views of Talos. This communication does not constitute an offer to buy or sell, or a promotion or recommendation of, any digital asset, security, derivative, commodity, financial instrument, or product or trading strategy. This document and information are not intended to constitute investment advice or a recommendation to make (or refrain from making) any kind of investment decision and may not be relied on as such.
Subscribe
If you’d like to get State of the Network in your inbox, please subscribe below.
Latest insights and research




Request a demo
Find out how Talos can simplify the way you interact with the digital asset markets.