
February 2026 Market Update: Crypto Caught Between Gold & Growth
State of the Network #352
February 2026 Market Update: Crypto Caught Between Gold & Growth

Introduction
State of the Network #352
Coin Metrics State of the Network is an unbiased, weekly view of the crypto market informed by our own network (on-chain) and market data.
Key Takeaways:
- Digital assets extended their correction in February as risk‑off sentiment and thinner liquidity left markets more vulnerable to shocks.
- Demand has softened, with a negative Coinbase premium, ETF outflows, and slowing stablecoin growth pointing to reduced institutional participation.
- As valuations reset, structural trends are still moving forward, with growing tokenization activity and deeper integration of onchain rails with traditional market infrastructure.
Introduction
February saw the continuation of a recent theme in the crypto industry, with fundamental progress clouded by weak price action as crypto finds itself caught between shifting macro currents. In this issue of State of the Network, we provide an overview of the market and onchain dynamics that shaped digital assets in February 2026.
Market Performance
February began with a sharp dislocation. Bitcoin briefly broke below $61,000 during a selloff over February 5-6, marking one of the weakest calendar year starts for crypto assets in over a decade. The broader digital asset market continued its correction from the October 2025 highs, extending a drawdown that has now erased nearly half of BTC’s peak value and pushed ETH (down about 34%) and Solana (down about 35%) back to levels last seen before the 2024 spot ETF approvals.
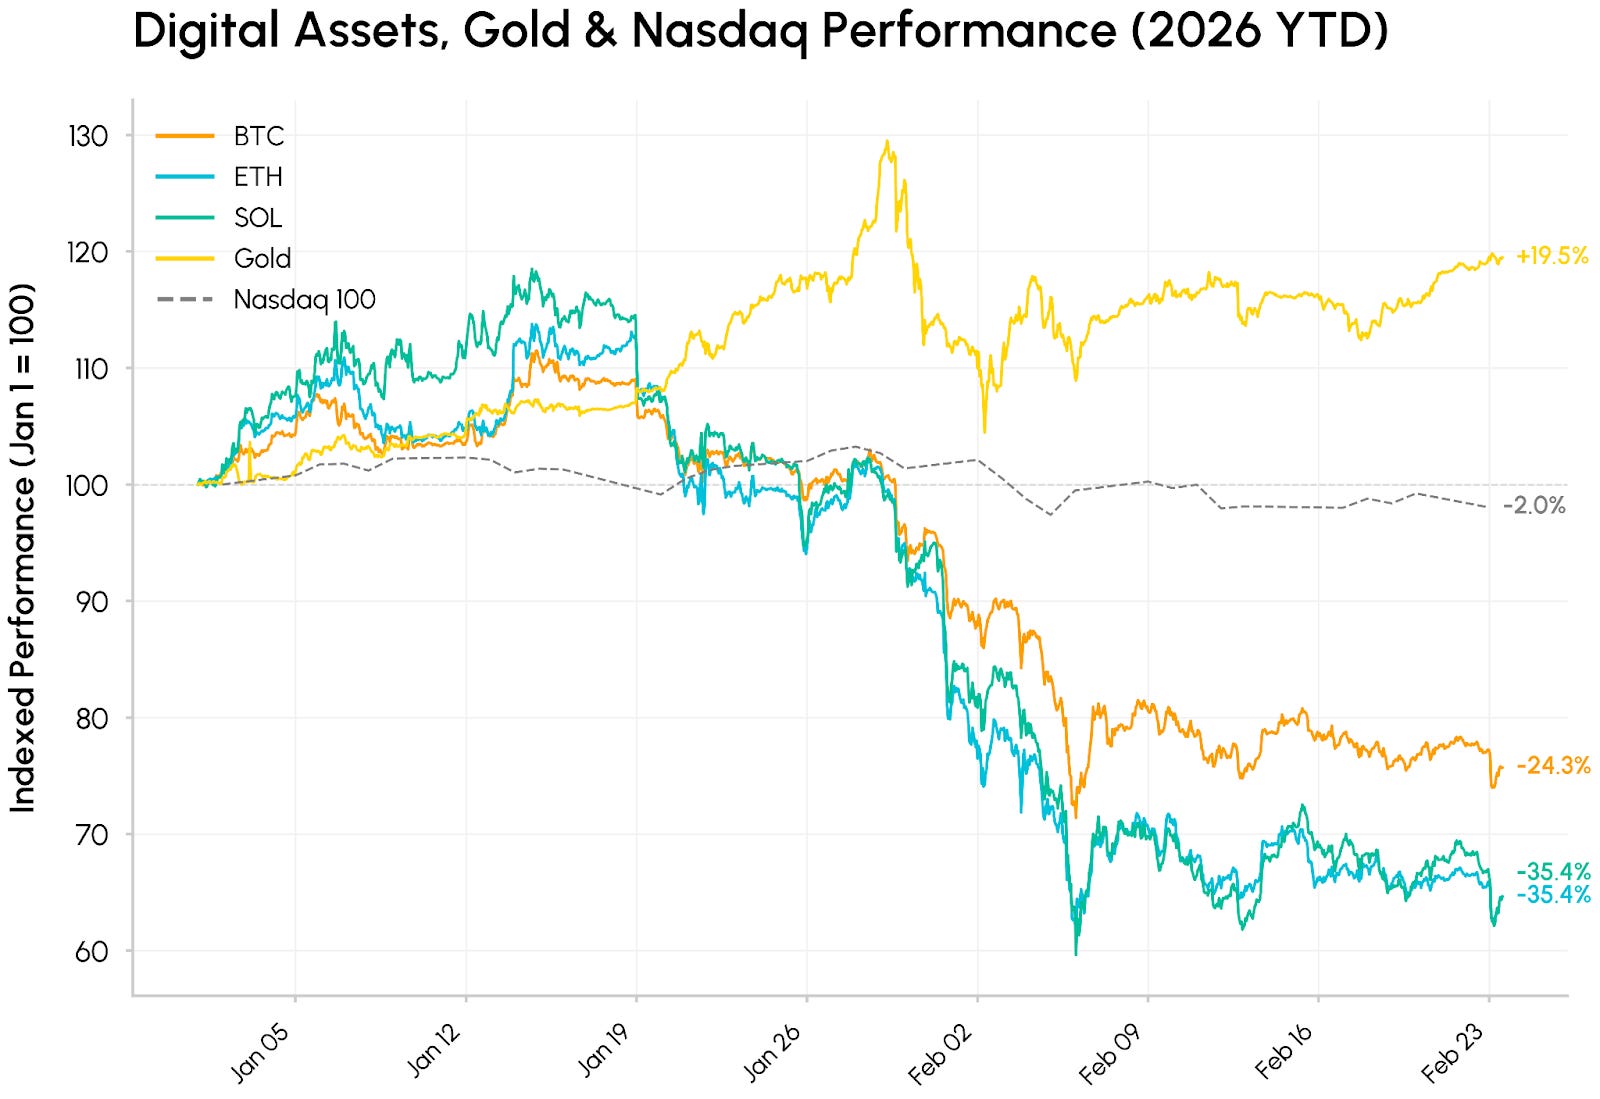
Source: Coin Metrics Reference Rates
This played out against widening divergence across asset classes. Gold’s run (+15% YTD) continued on the back of safe haven demand and a broader bid for non dollar stores of value, amid geopolitical and tariff uncertainty. In this risk-off environment, crypto has traded as high‑beta tech exposure, selling off alongside growth equities as markets react to fast moving AI developments and disruption risks. Caught between these forces, crypto’s weakness looks more like a combination of fading risk appetite, low liquidity and ongoing deleveraging, rather than any fundamental breakdown.
Within the crypto market, the selloff was broad based across sectors. Notable outperformers included Morpho (MORPHO), benefiting from growing adoption of vaults and Apollo Global Management’s agreement to acquire up to 90 million MORPHO tokens (representing 9% of total supply over 48 months).
A Pullback in Flows
Behind the drawdown, key sources of demand and liquidity have deteriorated in tandem. The Coinbase Premium Index, which tracks the difference between BTC/USD on Coinbase and BTC/USDT on Binance, serves as a proxy for U.S. spot market demand.
It has been in persistent negative territory since November 2025, deepening sharply through February, a sign of sustained U.S. selling pressure and a lack of fresh institutional buying. More recently, the premium has started to recover, suggesting that the worst of the U.S. spot selling may be behind us even though demand remains muted.
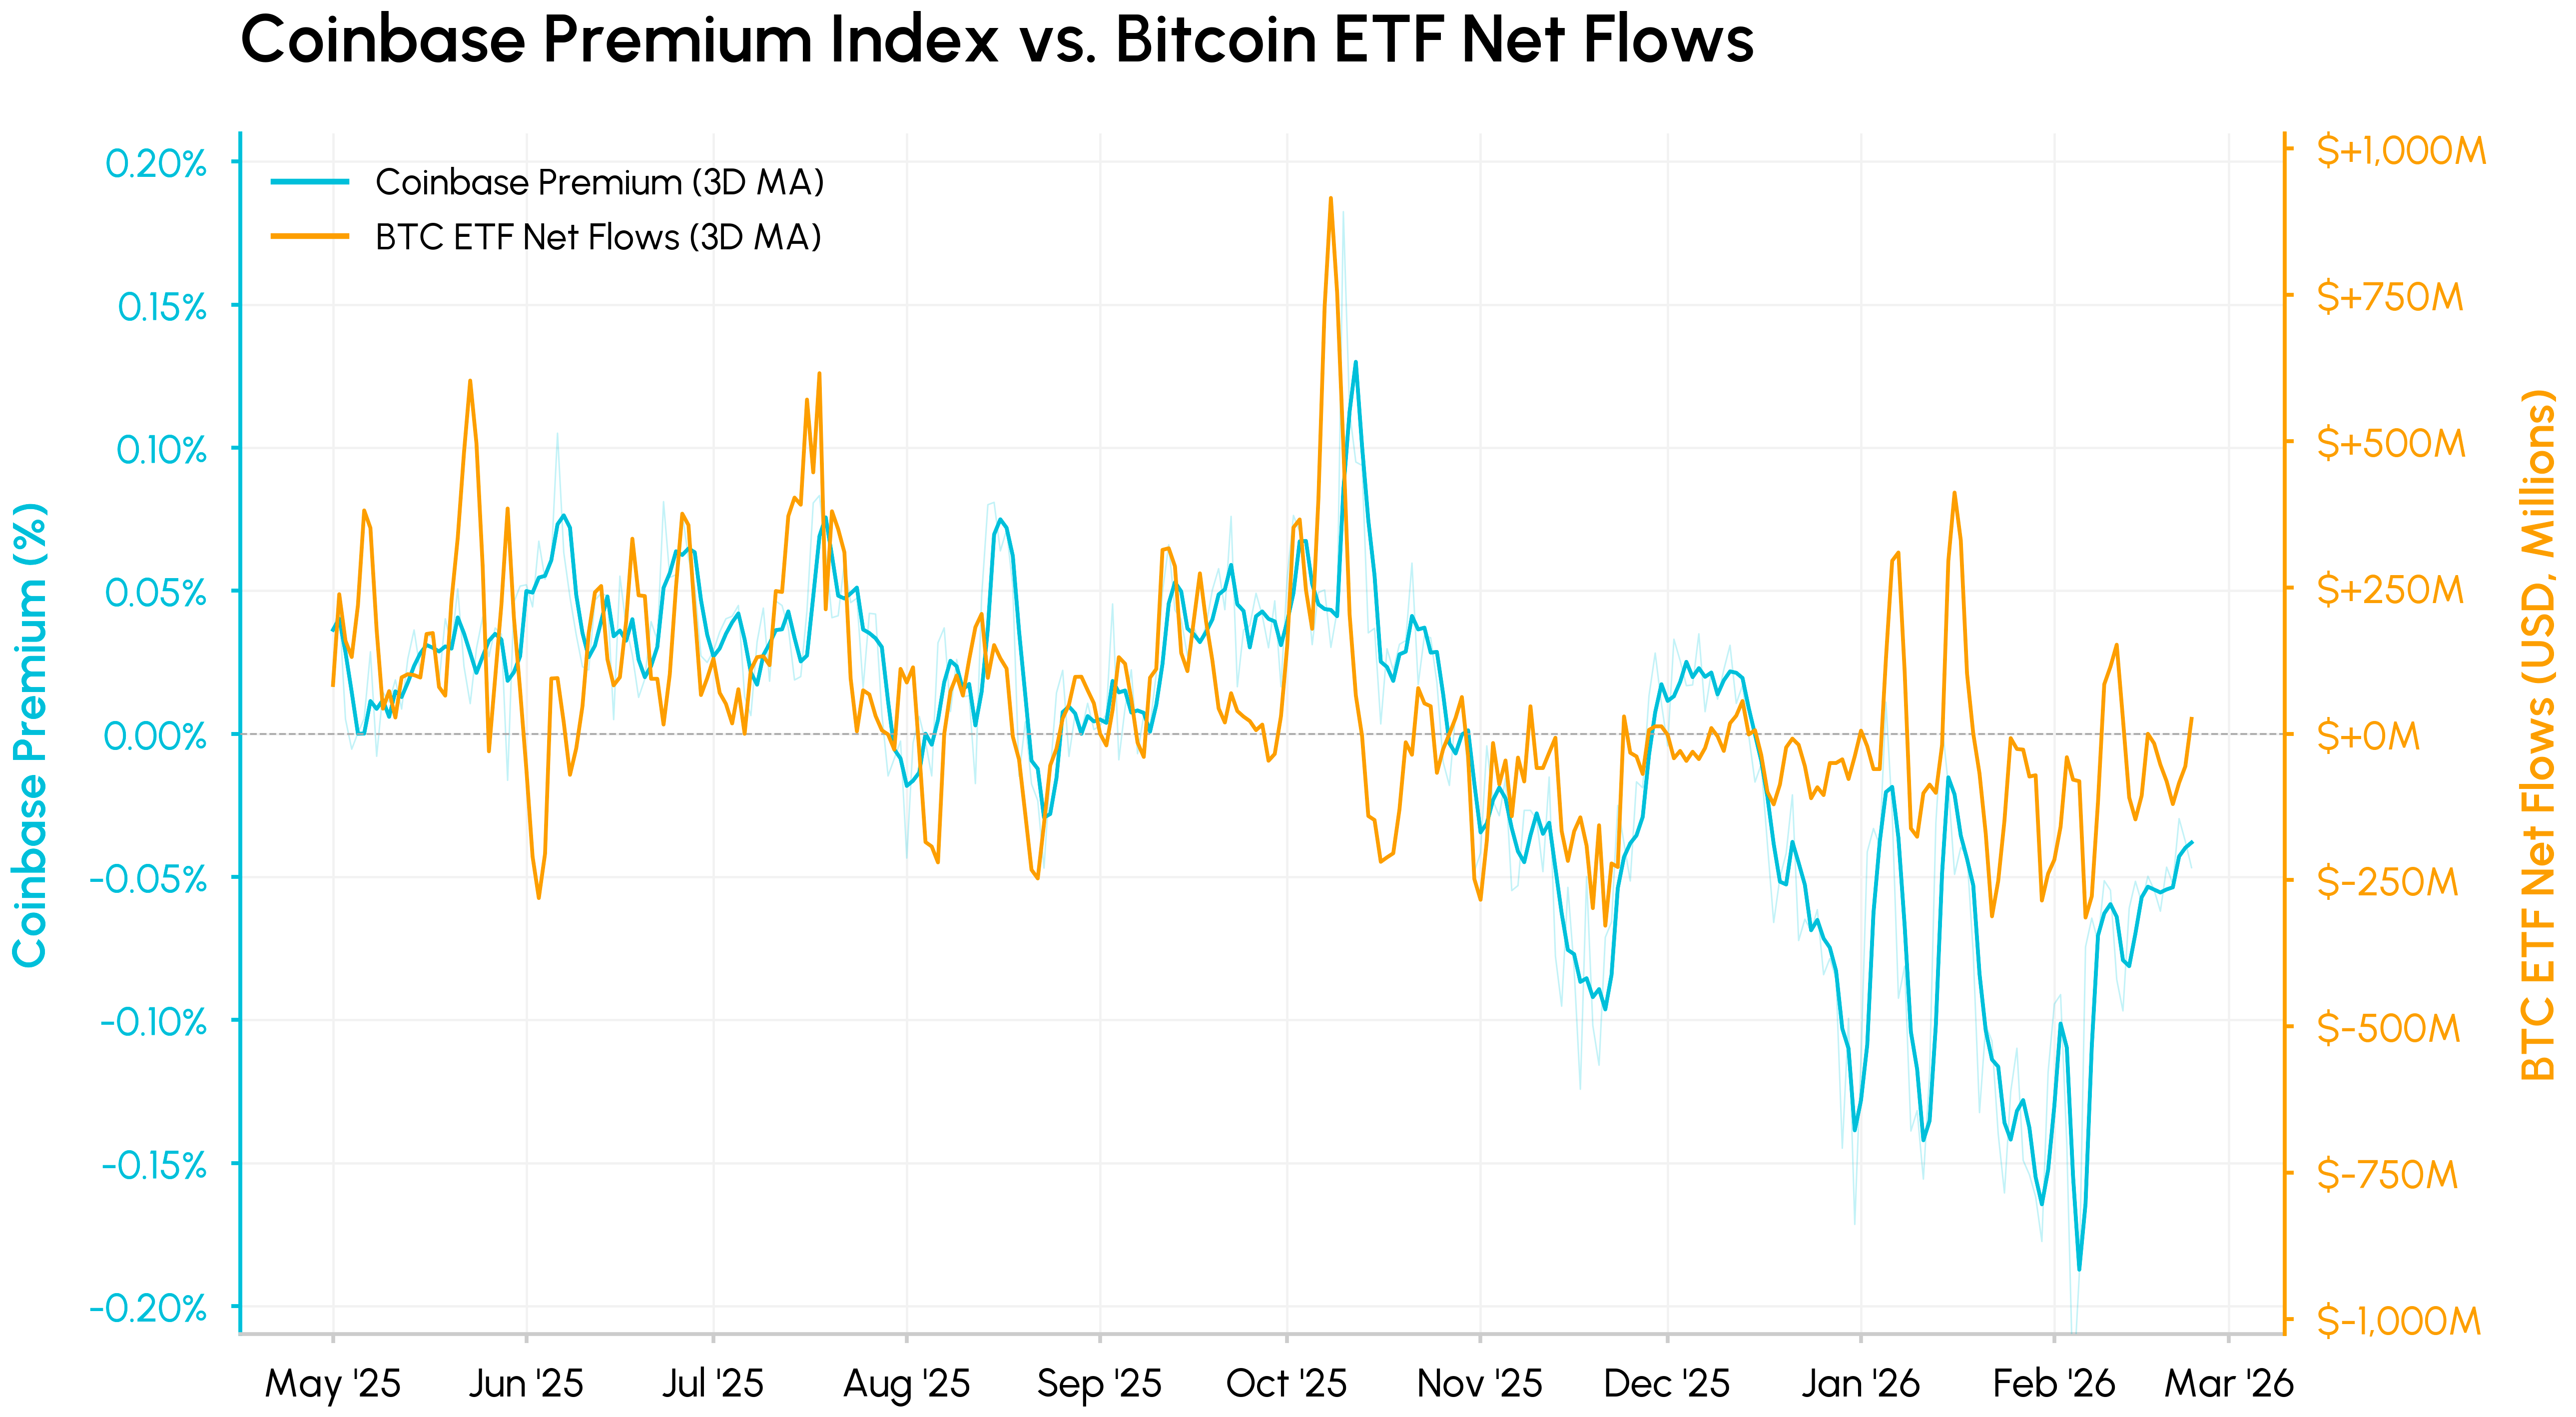
Source: Coin Metrics Market Data Feed & Network Data Pro
Overlaid against Bitcoin ETF net flows, the co-movement is notable. Both series measure U.S. institutional demand from different angles, and crossed below zero around the same period. The premium tends to lead flows lower on each leg down, as spot price reacts immediately while ETF redemptions take longer to materialize. Spot Bitcoin ETFs recorded over $4B in cumulative net outflows YTD, reversing a meaningful share of inflows from last year.
Thinner Liquidity and Volatile Volumes
Compounding this, market liquidity also remains fragile. Average spot BTC order book depth across major exchanges, measured as liquidity within ±2% of mid-price, collapsed from roughly $40–50M in August through October 2025 to a sustained $15–25M range. Liquidity has thinned further in February, directly amplifying the severity of price dislocations.
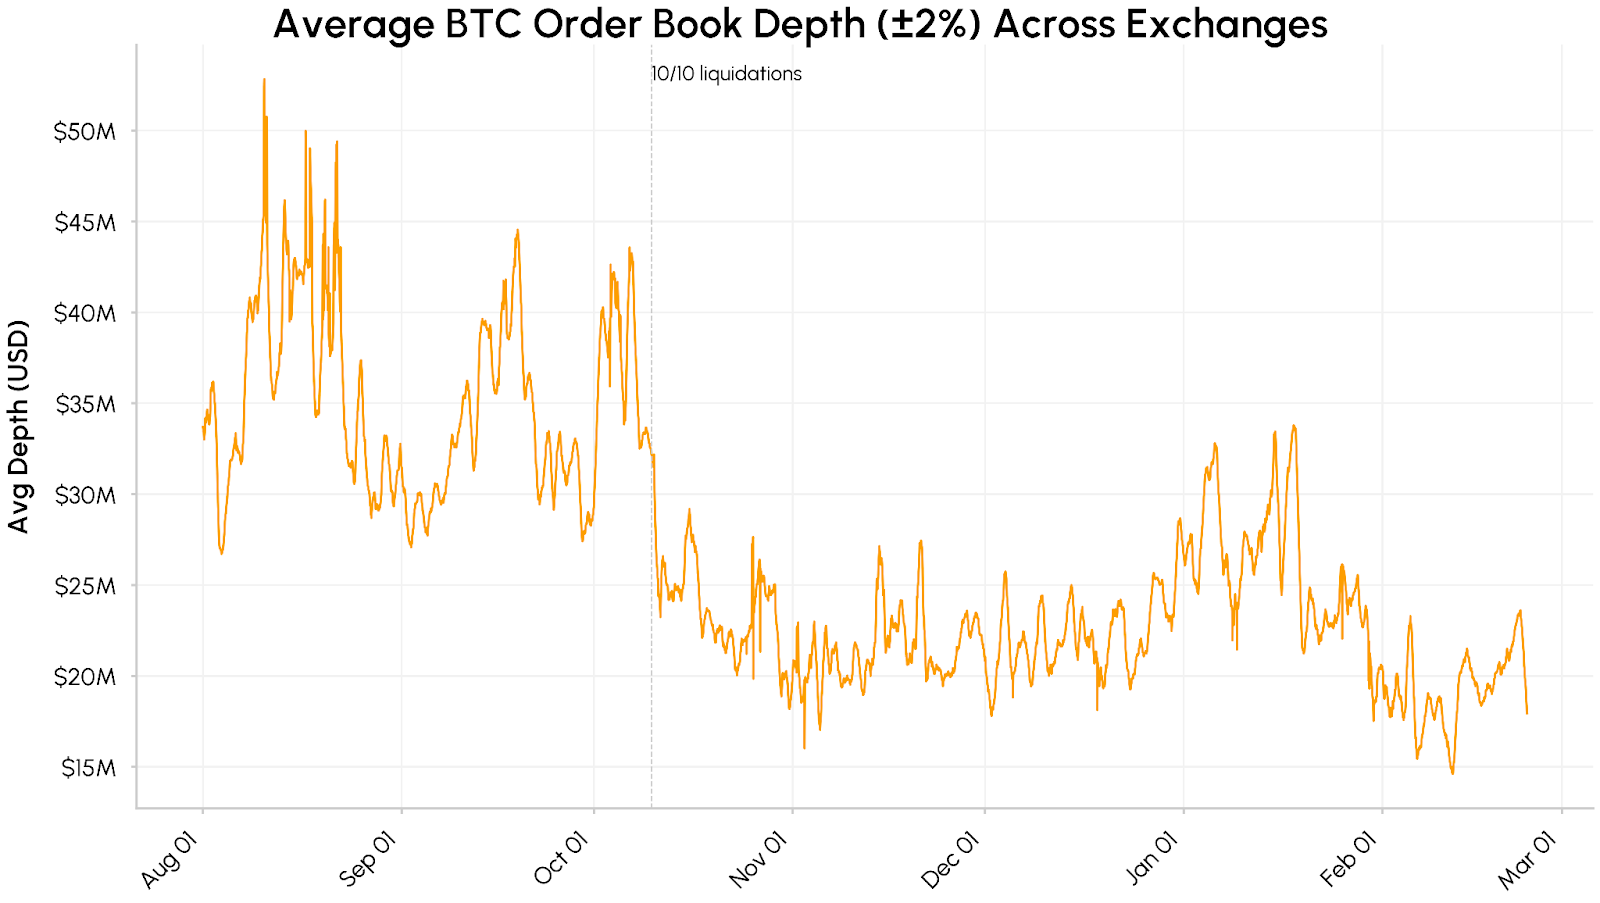
Source: Coin Metrics Market Data Pro
Similarly, stablecoin supply growth has also slowed since December. The aggregate market cap of USDT and USDC has hovered around $260B, suggesting that fresh capital inflows have stalled rather than flowing out of the ecosystem entirely. Taken together, flows point to retreating institutional demand, thin orderbook depth, and slowed stablecoin growth, leaving the conditions for a sustained recovery still incomplete.
Source: Coin Metrics Market Data Pro
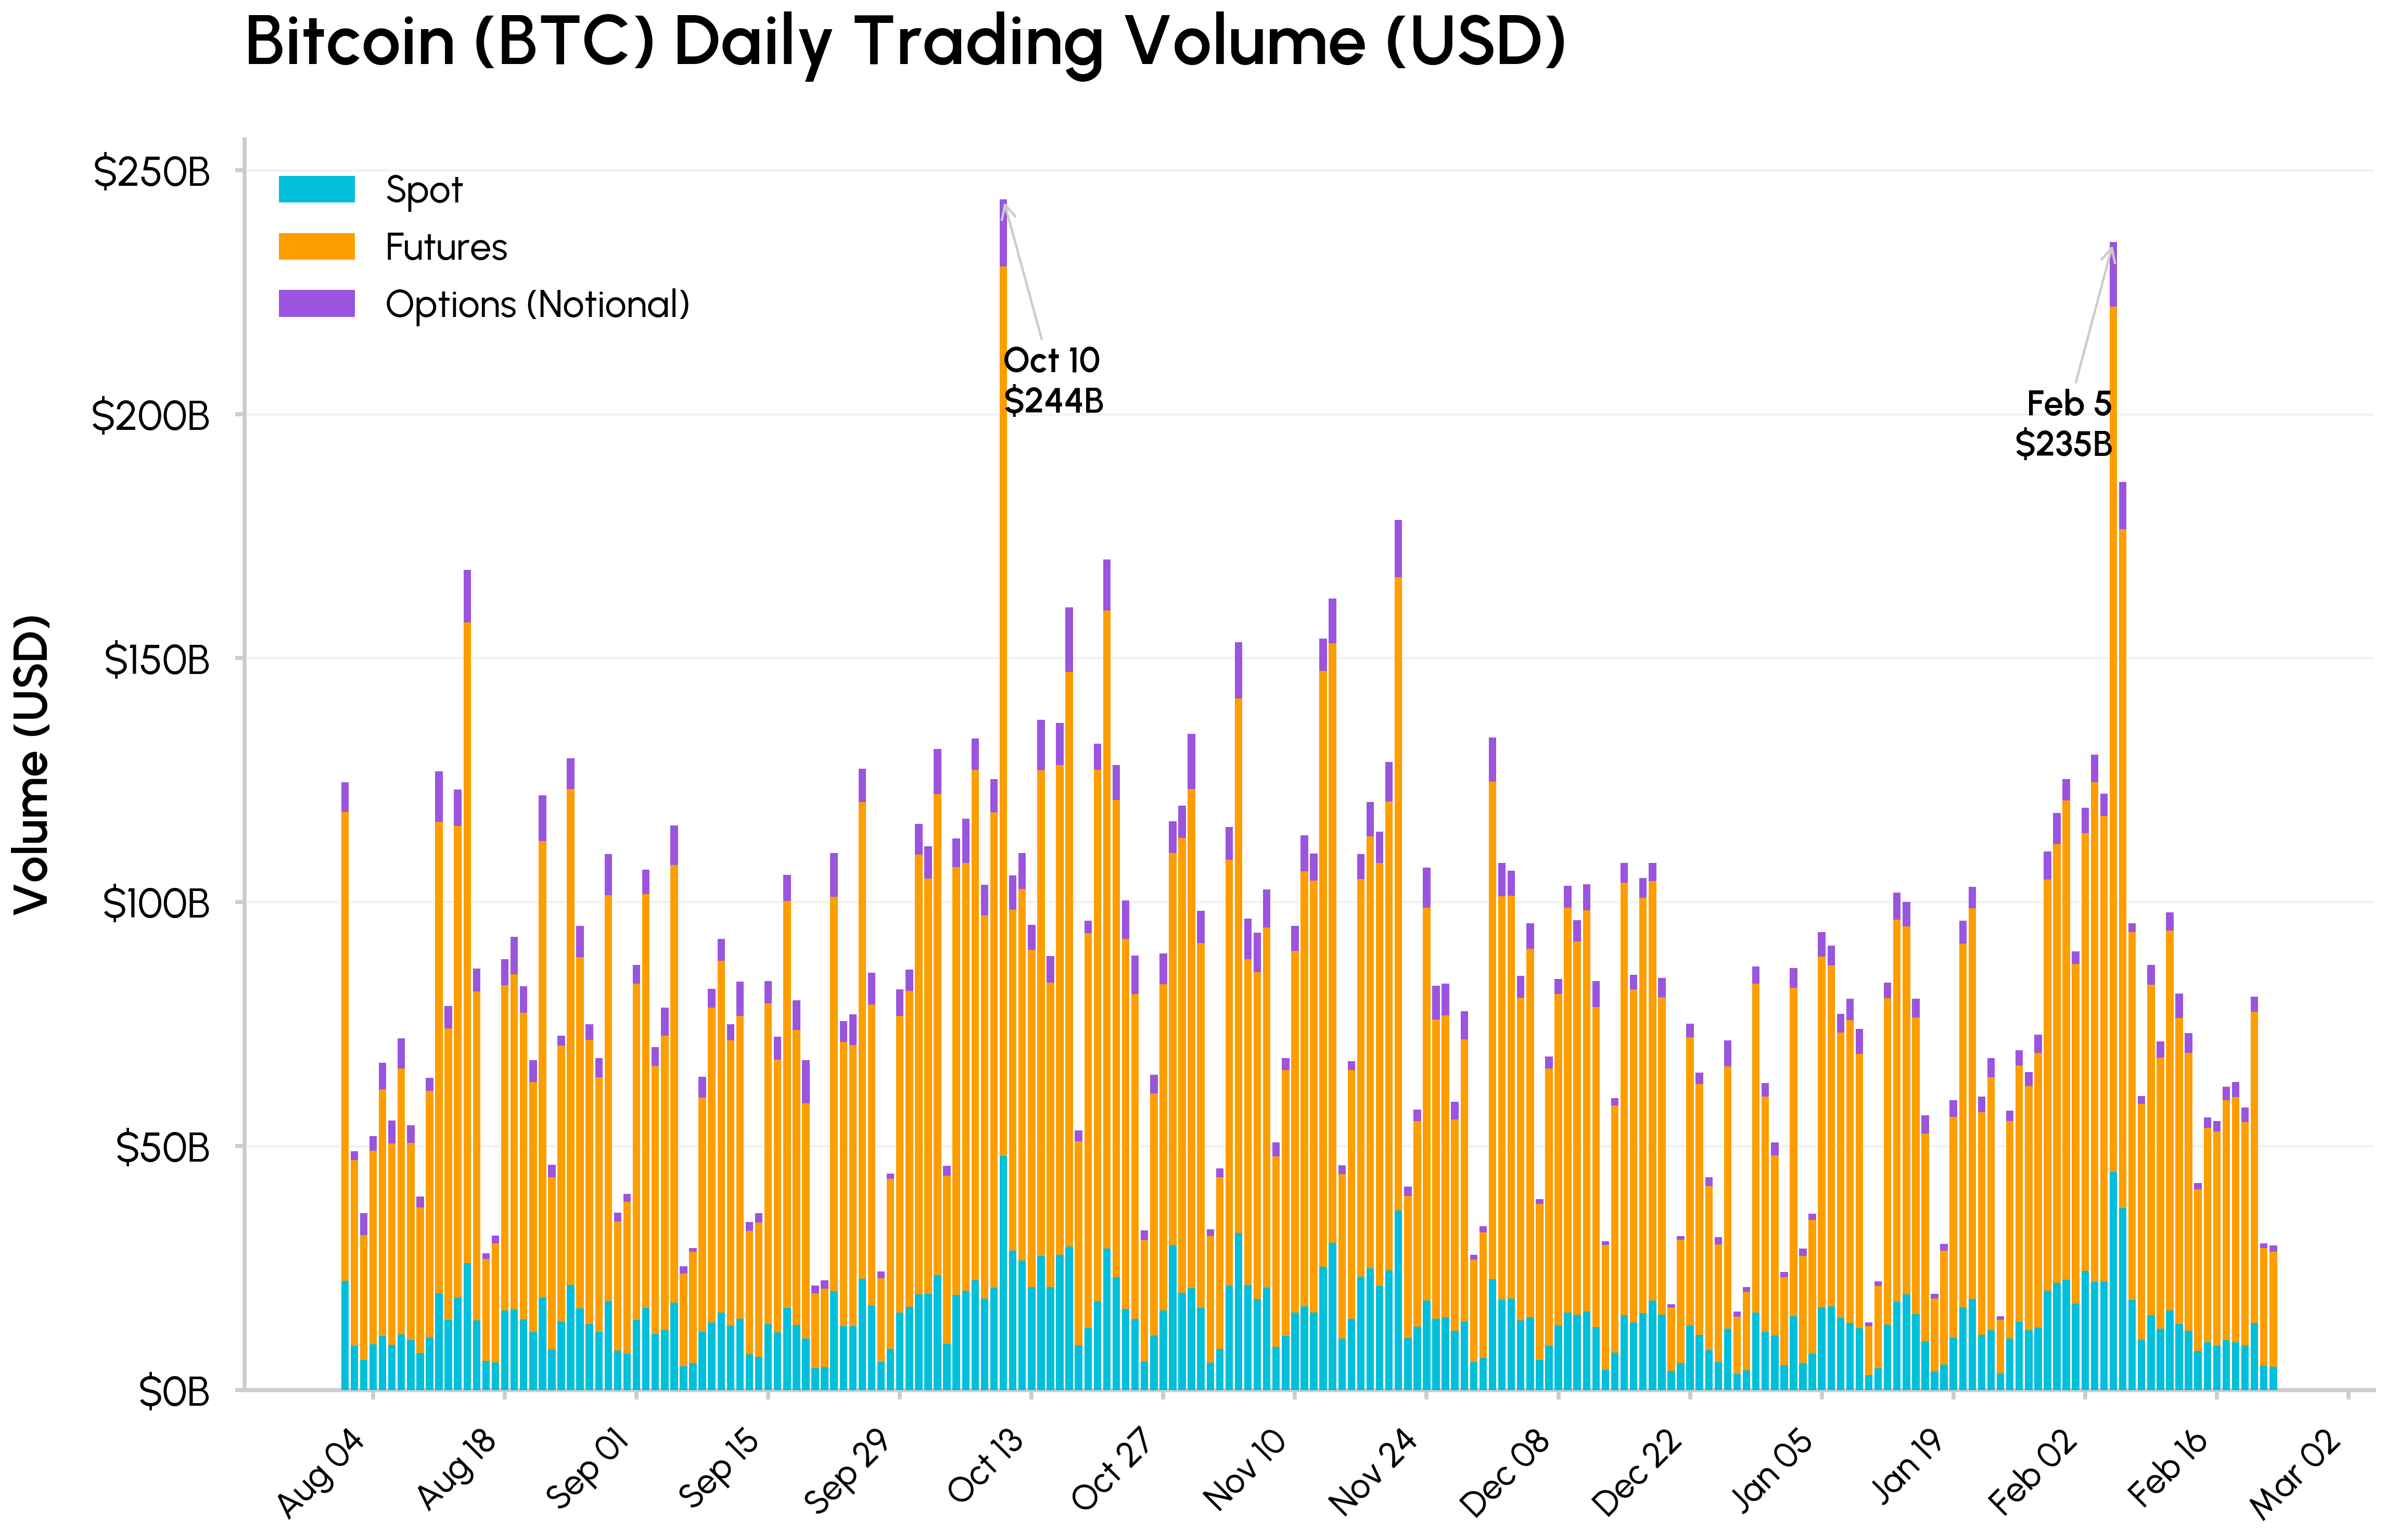
Trading volume across spot, futures and options spiked sharply on both October 10th and February 5th. Total BTC volume reached $244B and $235B respectively, with futures dominating at $177B on February 5th. Spot volume was marginally lower than in October despite a comparably severe dislocation, consistent with thinner order books amplifying the move. Historically, high‑volume selloffs of this kind often coincide with the exhaustion of forced selling, suggesting the most aggressive phase of the drawdown may be nearing its end.
Onchain RWA Perpetuals on Hyperliquid
Meanwhile, momentum has continued to build around real-world asset (RWA) tokenization and the convergence of onchain and traditional finance. Hyperliquid has been one of the primary beneficiaries of this, extending its dominance in onchain perpetual futures beyond crypto to commodities, equities and index products like the Nasdaq 100 Index (XYZ100). This expansion has been enabled by Hyperliquid’s HIP-3, a protocol upgrade that allows permissionless creation of perpetual markets for any asset with their own oracles and fee structures.
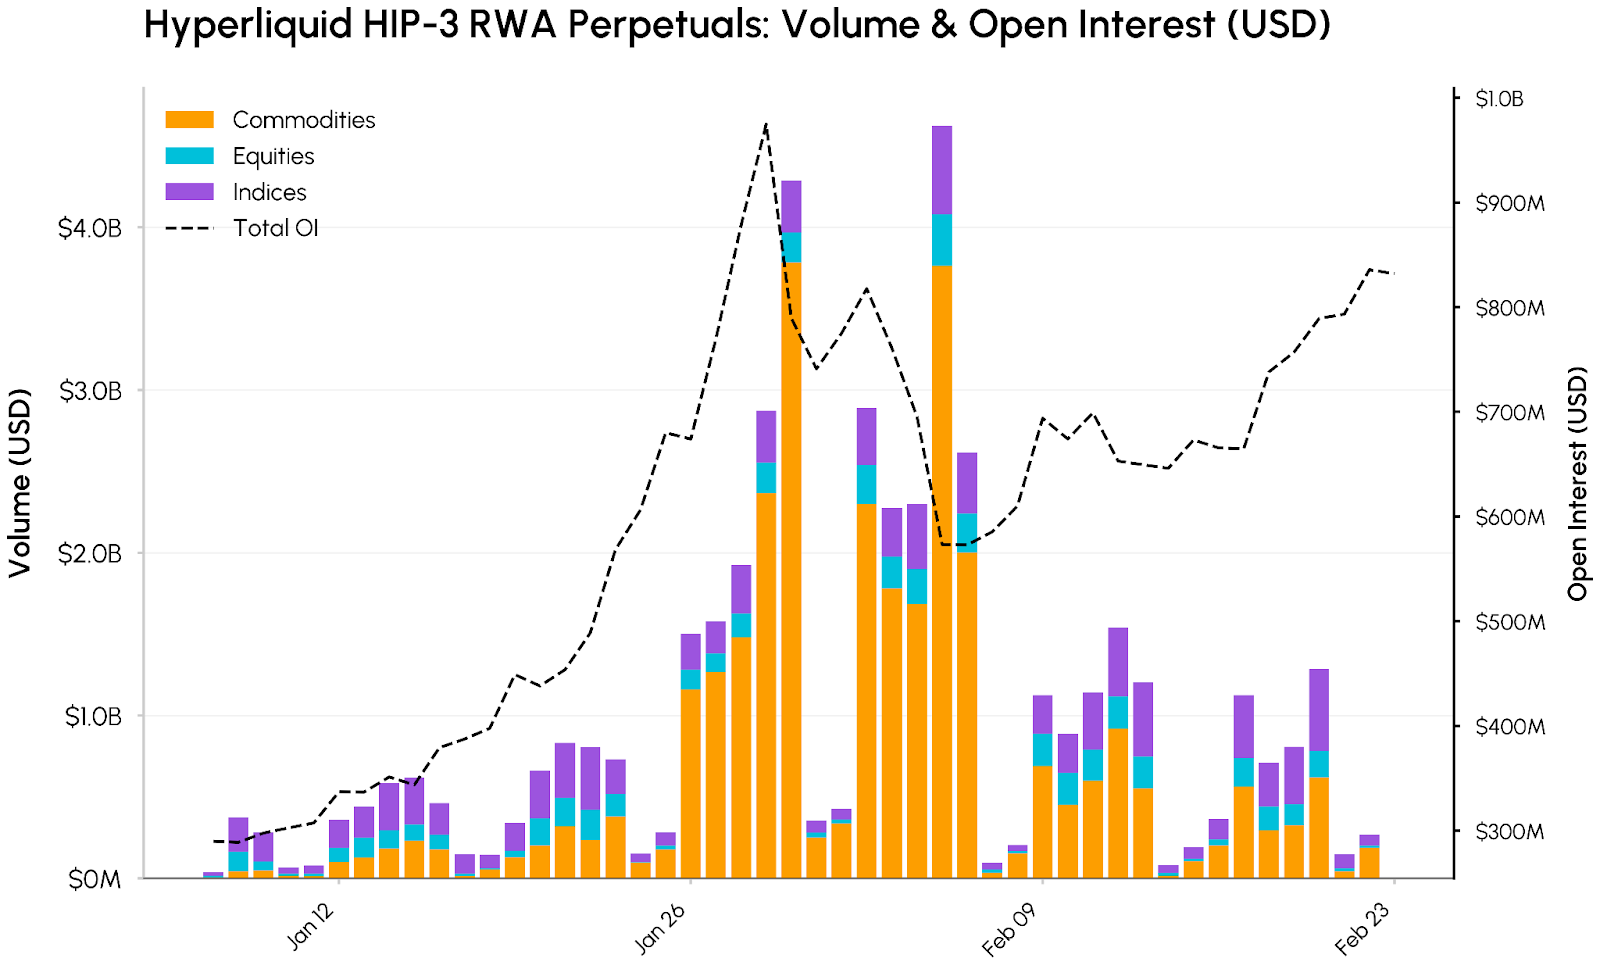
Source: Coin Metrics Market Data Feed
While BTC and ETH remain the largest assets by open interest, HIP‑3 markets now represent a growing share of activity on the platform. Total HIP-3 perpetual volume peaked at roughly $4.6B on February 5th, driven primarily by commodities, which accounted for about $3.8B on the day and more than $30B in cumulative volume since January. Gold and silver have been particular standouts, with silver volumes reaching a peak of $3.4B.
Open interest has grown in tandem. Aggregate OI in HIP‑3 markets rose from about $290M at the start of January to a peak near $975M by January 29th, before consolidating around $830M by late February. This trajectory highlights that, even as headline crypto prices correct, demand for on‑chain access to commodities, equities and index exposures continues to deepen.
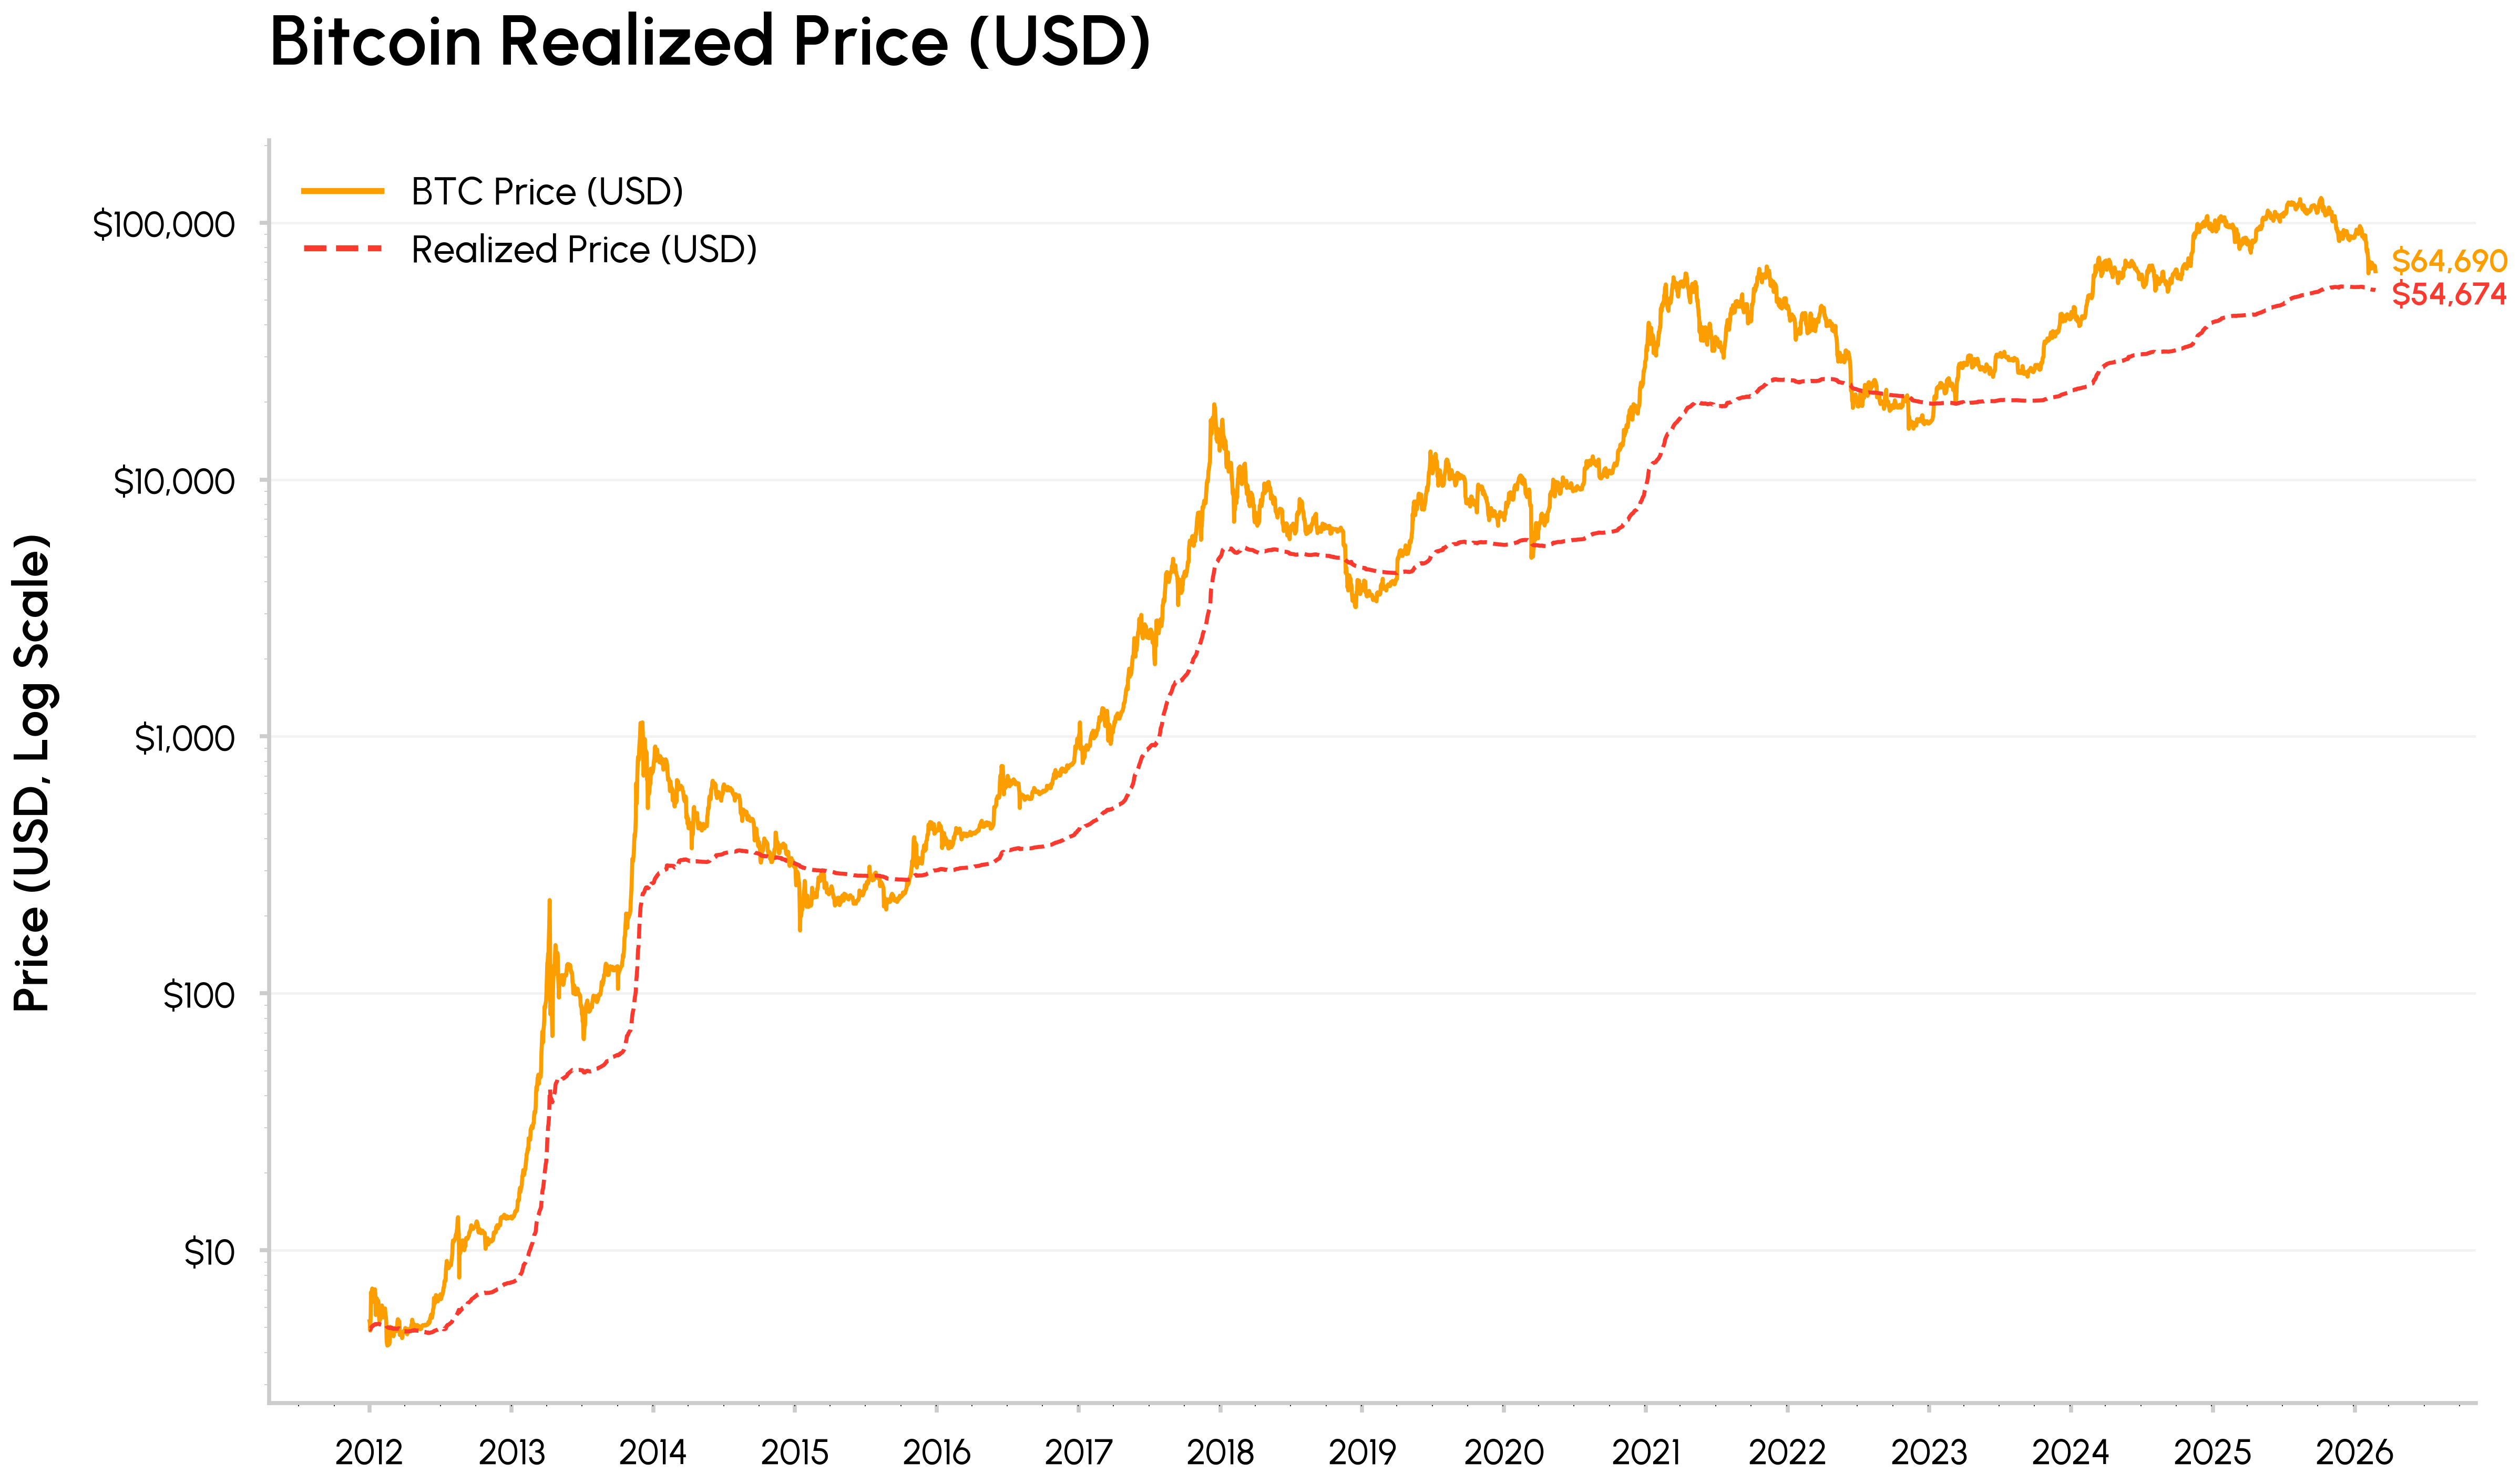
The “Value” Zone
Bitcoin’s latest leg lower has brought it closer to its realized price, currently around $55K, which represents the average on‑chain cost basis for all coins. At past cycle lows, BTC has often traded near or below realized price as the market moves from euphoria into capitulation and eventual accumulation.
Source: Coin Metrics Network Data Pro
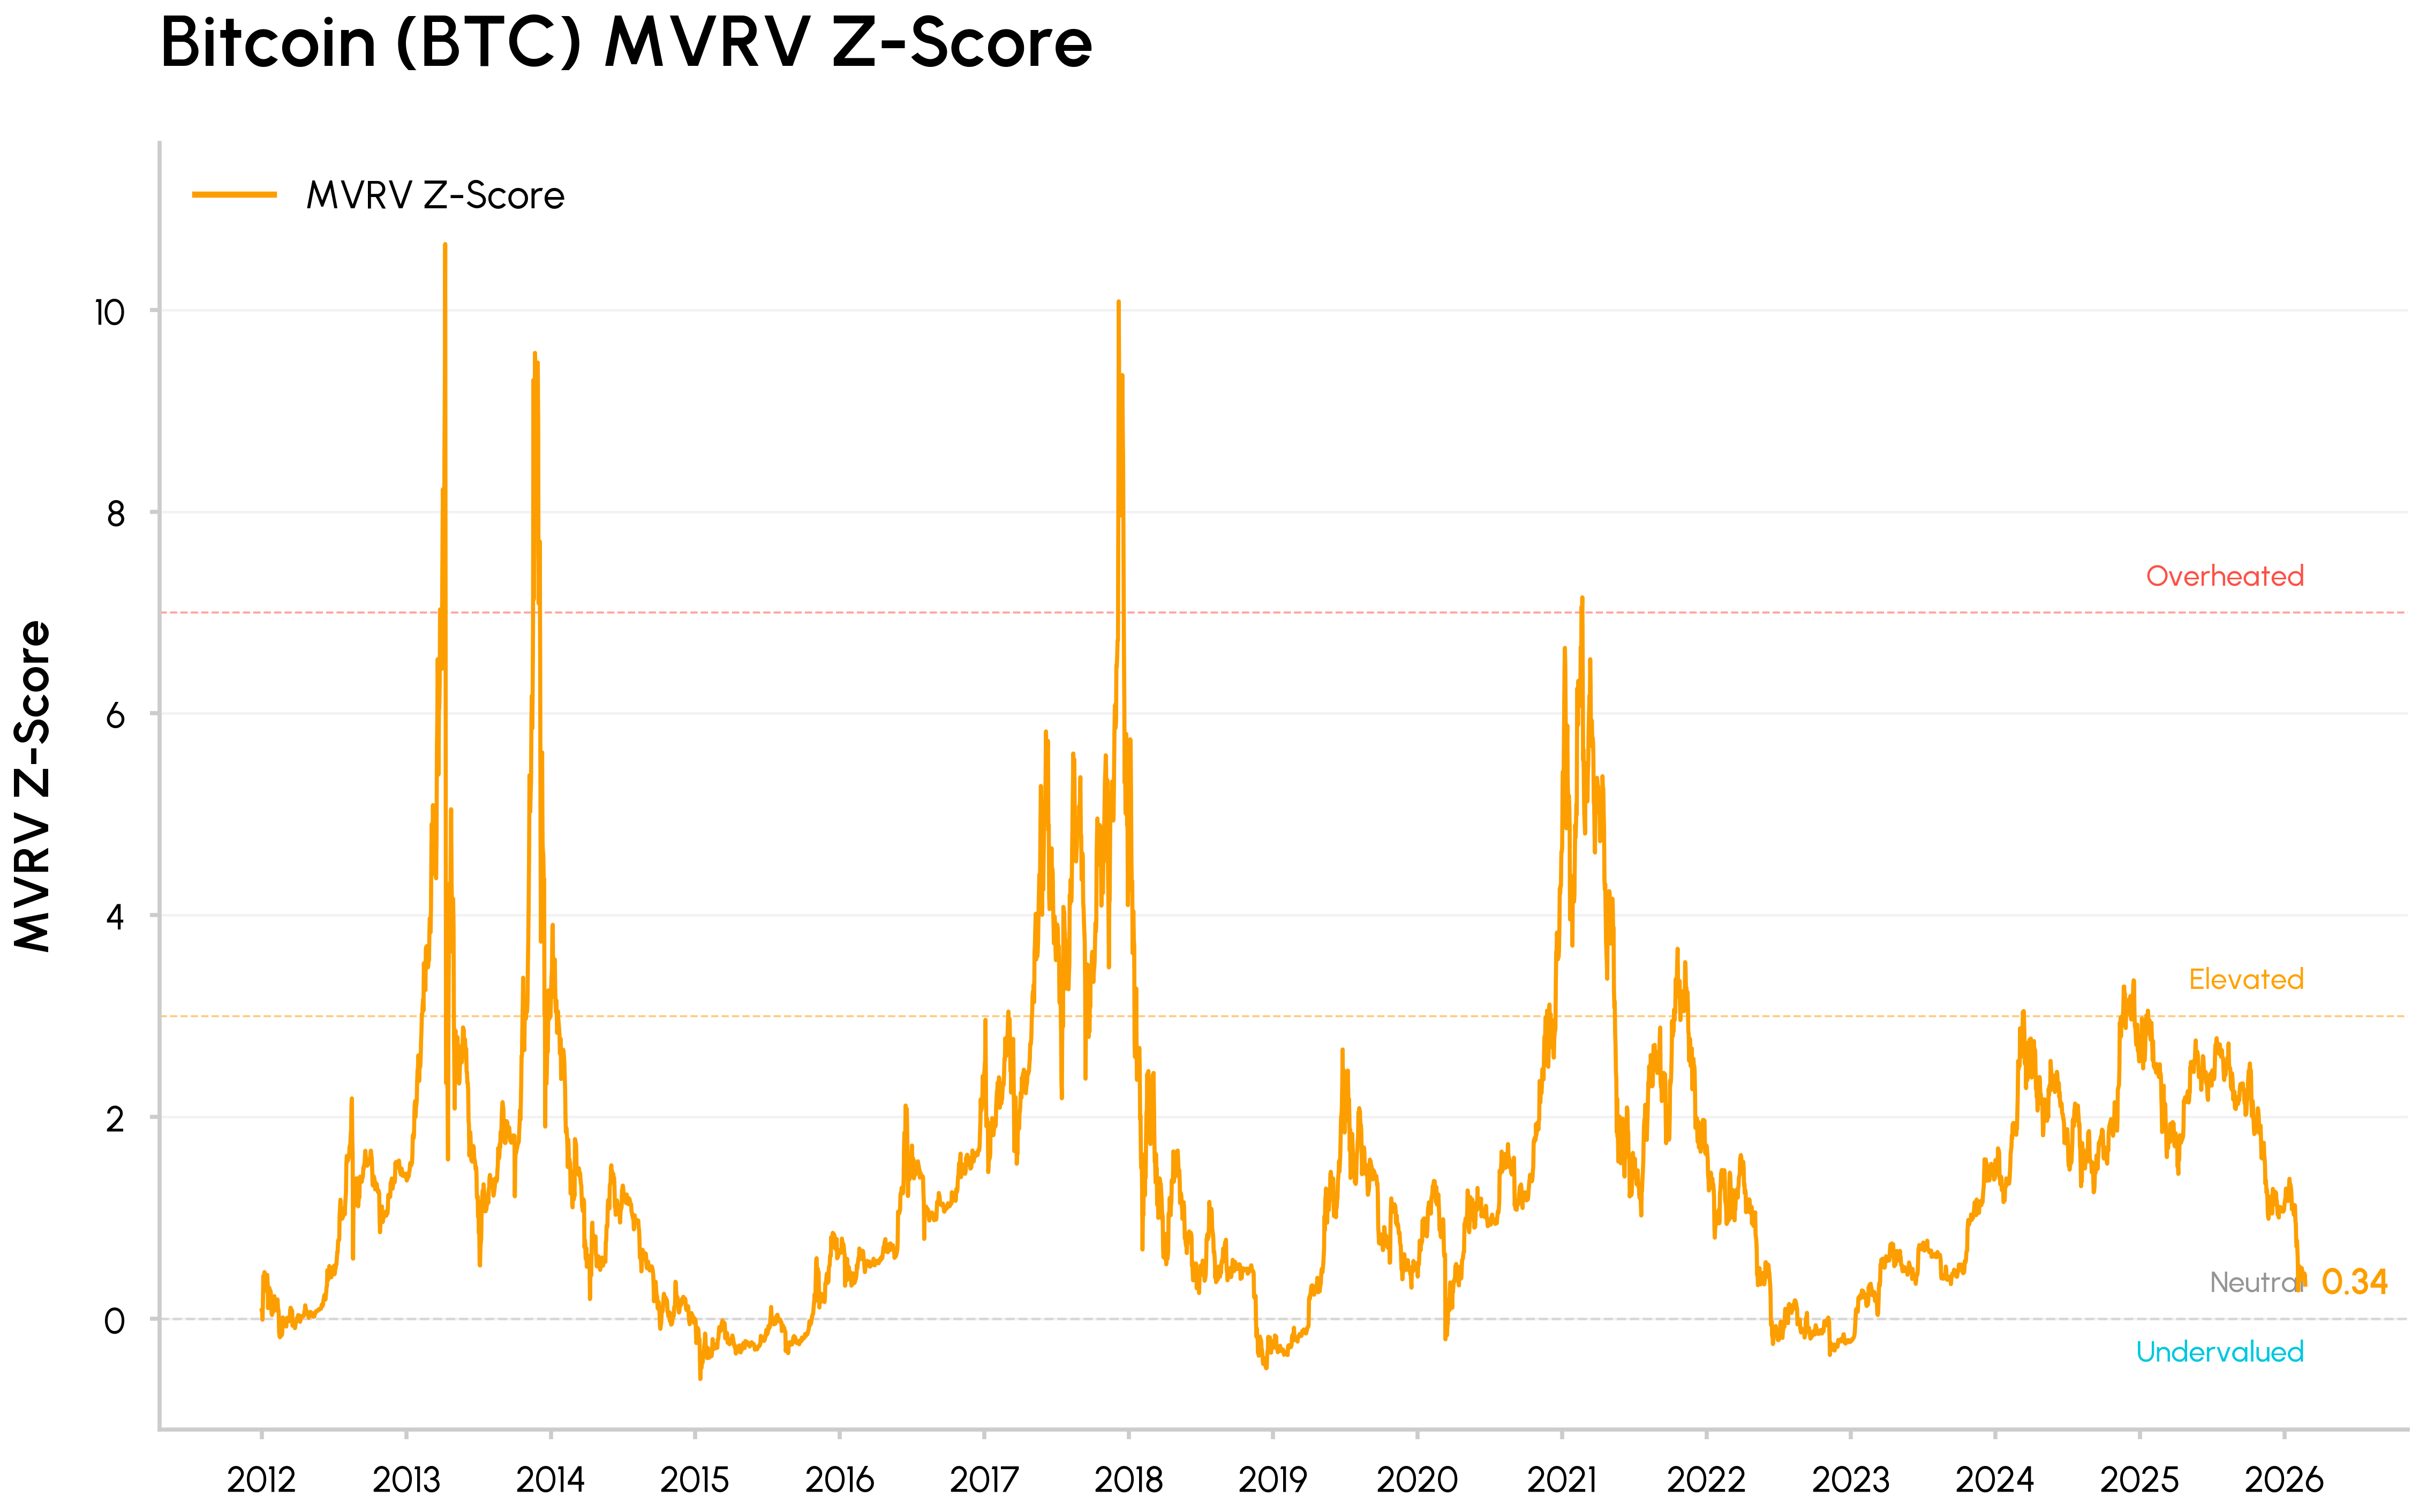
At the same time, valuation metrics such as MVRV (which compares Bitcoin’s market value to the aggregate onchain cost basis of holders), has compressed toward its historical undervaluation bands but have not yet reached the extreme levels associated with prior bear market bottoms. These indicators point to a market that has shed much of its earlier excess and is drifting toward a value zone.
Source: Coin Metrics Network Data Pro
Beneath the reset in prices, several trends continue to push crypto further into mainstream market infrastructure. Hyperliquid’s HIP‑3 illustrates how crypto rails are increasingly being used to trade traditional assets. BlackRock’s move to bring its tokenized BUIDL fund to Uniswap and Apollo’s agreement to acquire MORPHO tokens similarly highlight institutions integrating DeFi liquidity and governance into their workflows.
In parallel, leading DeFi protocols like Aave and Uniswap are gradually moving toward clearer token‑holder alignment and value accrual, shifting the sector away from purely narrative and governance driven tokens toward more cash flow oriented assets. On the TradFi side, CME’s decision to roll out 24/7 crypto futures trading and the CFTC’s more constructive stance on prediction markets show regulated venues and policymakers adapting to crypto’s always‑on structure.
Conclusion
February’s drawdown looks less like a fundamental break and more like a test of flows and liquidity in a risk‑off environment. Crypto is trading as a liquidity sensitive, growth linked asset, even as its role in market infrastructure, institutional portfolios, and onchain integration continues to deepen. The near term may remain choppy, but progress on the CLARITY Act and a reversal in flows will be key catalysts to watch for a more durable resurgence in demand.
Disclaimer: The information herein is provided for informational purposes only. Talos Trading, LLC and its affiliates (“Talos”) does not give any representations or warranties in relation to the accuracy, validity, or completeness of the information of this material, including without limitation the factual information obtained from publicly available sources considered by Talos to be reliable at the time. Talos accepts no liability for any consequences of using the information contained in this material. Any opinions or estimates expressed herein reflect a judgment made by the author(s) as of the date of publication and are subject to change without notice. Neither this material nor any copy thereof may be taken, reproduced, or redistributed, directly or indirectly, without Talos’s prior written permission. Any views or opinions expressed are those of the authors and do not necessarily reflect the views of Talos. This communication does not constitute an offer to buy or sell, or a promotion or recommendation of, any digital asset, security, derivative, commodity, financial instrument, or product or trading strategy. This document and information are not intended to constitute investment advice or a recommendation to make (or refrain from making) any kind of investment decision and may not be relied on as such.
Subscribe
If you’d like to get State of the Network in your inbox, please subscribe below.
Latest insights and research


Request a demo
Find out how Talos can simplify the way you interact with the digital asset markets.