

Talos Exchange Scorecard, Plus Digging into the Coldcard Exploit On-Chain
State of the Network #375
Talos Exchange Scorecard, Plus Digging into the Coldcard Exploit On-Chain

Introduction
State of the Network #375
Coin Metrics State of the Network is an unbiased, weekly view of the crypto market informed by our own network (on-chain) and market data.
- Exchange liquidity forms a continuum. Spread and slippage broadly agree across venues, and no single exchange offers the cheapest execution across all three BTC pairs.
- Trade size distributions remain a strong indicator for highlighting anomalous trading activity.
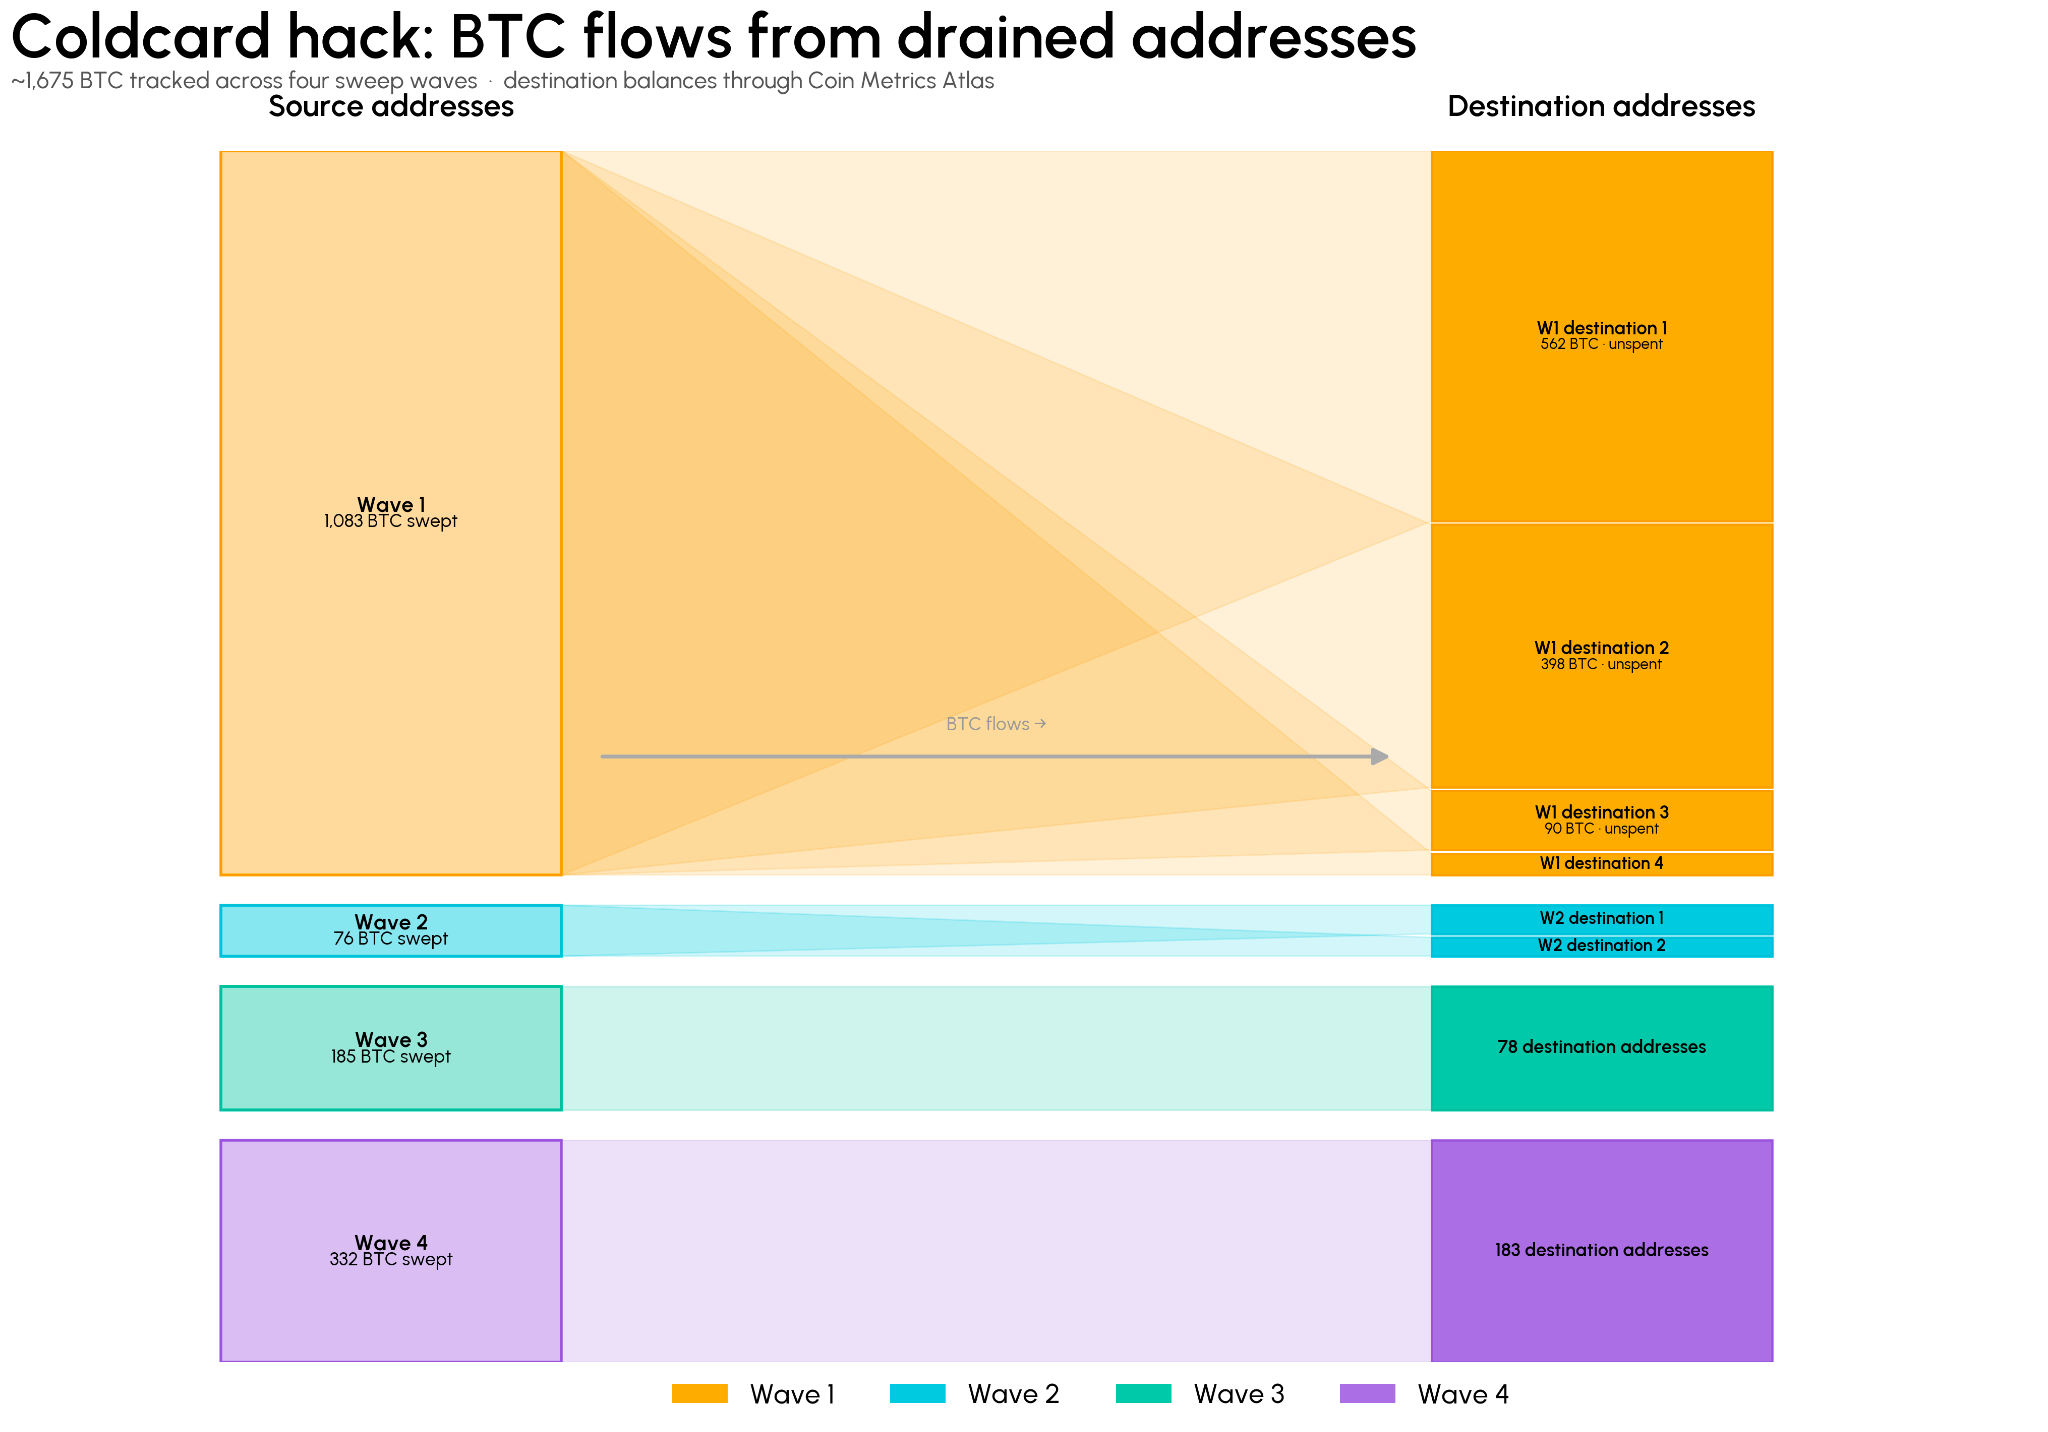
- A predictable RNG in Coldcard firmware drained more than 1,800 BTC from roughly 4,500 addresses. The exploit ran in four waves; the first consolidated 1,083 BTC into just four addresses, while later waves fragmented funds across hundreds of destinations.
Introduction
Comparing digital asset exchanges has historically been challenging because exchanges serve several different purposes. Traders generally favor venues that offer the most liquid markets and cheapest execution. Wash-trading detection is a useful tool for researchers relying on precise metrics for modeling and analysis. And for constructing prices and indexes, selecting sufficiently liquid and compliant constituent markets determines whether a benchmark tracks the market it claims to represent, especially for long-tail assets.
The Talos Exchange Scorecard (or TES, formerly known as the “Coin Metrics Trusted Exchange Framework”) is a holistic framework that unifies these perspectives. In this issue, we walk through the latest TES results, then cover the ongoing Coldcard exploit, the on-chain sequence of events, and its second-order effect on custody. The full TES methodology can be found here.
Comparing Liquidity Across Exchanges
Liquidity metrics measure how efficiently you can trade in a single market. Traders use these metrics to make informed decisions on how to size orders and where to execute them.
Spread and slippage measure execution cost at two different order sizes. The bid-ask spread is the gap between the best bid and the best ask, expressed in basis points of the mid price. It is the cost of crossing the book for an order small enough to fill at the top level. Slippage asks the same question deeper into the book: the difference between the volume-weighted fill price of a $100,000 market order and the mid price, averaged across the buy and sell sides.
Reading them together matters because they can disagree. A venue can quote a tight spread on a thin top level and still cost tens of basis points to trade in size, which is the case when displayed liquidity sits almost entirely at the best bid and offer. When spread is tight and slippage is wide, a venue is advertising a price it cannot fill at size. A venue tight on both absorbs institutional order flow without moving the price.
Below, we’ll compare the average slippage and spread of each exchange for BTC-Stablecoin markets. Both measures are sampled through the six-month window, time-averaged, and rolled up to the exchange as a volume-weighted average across its BTC-USD, BTC-USDT, and BTC-USDC markets. We ordered exchanges from cheapest to most expensive execution, left to right.
Spread and Slippage by Exchange
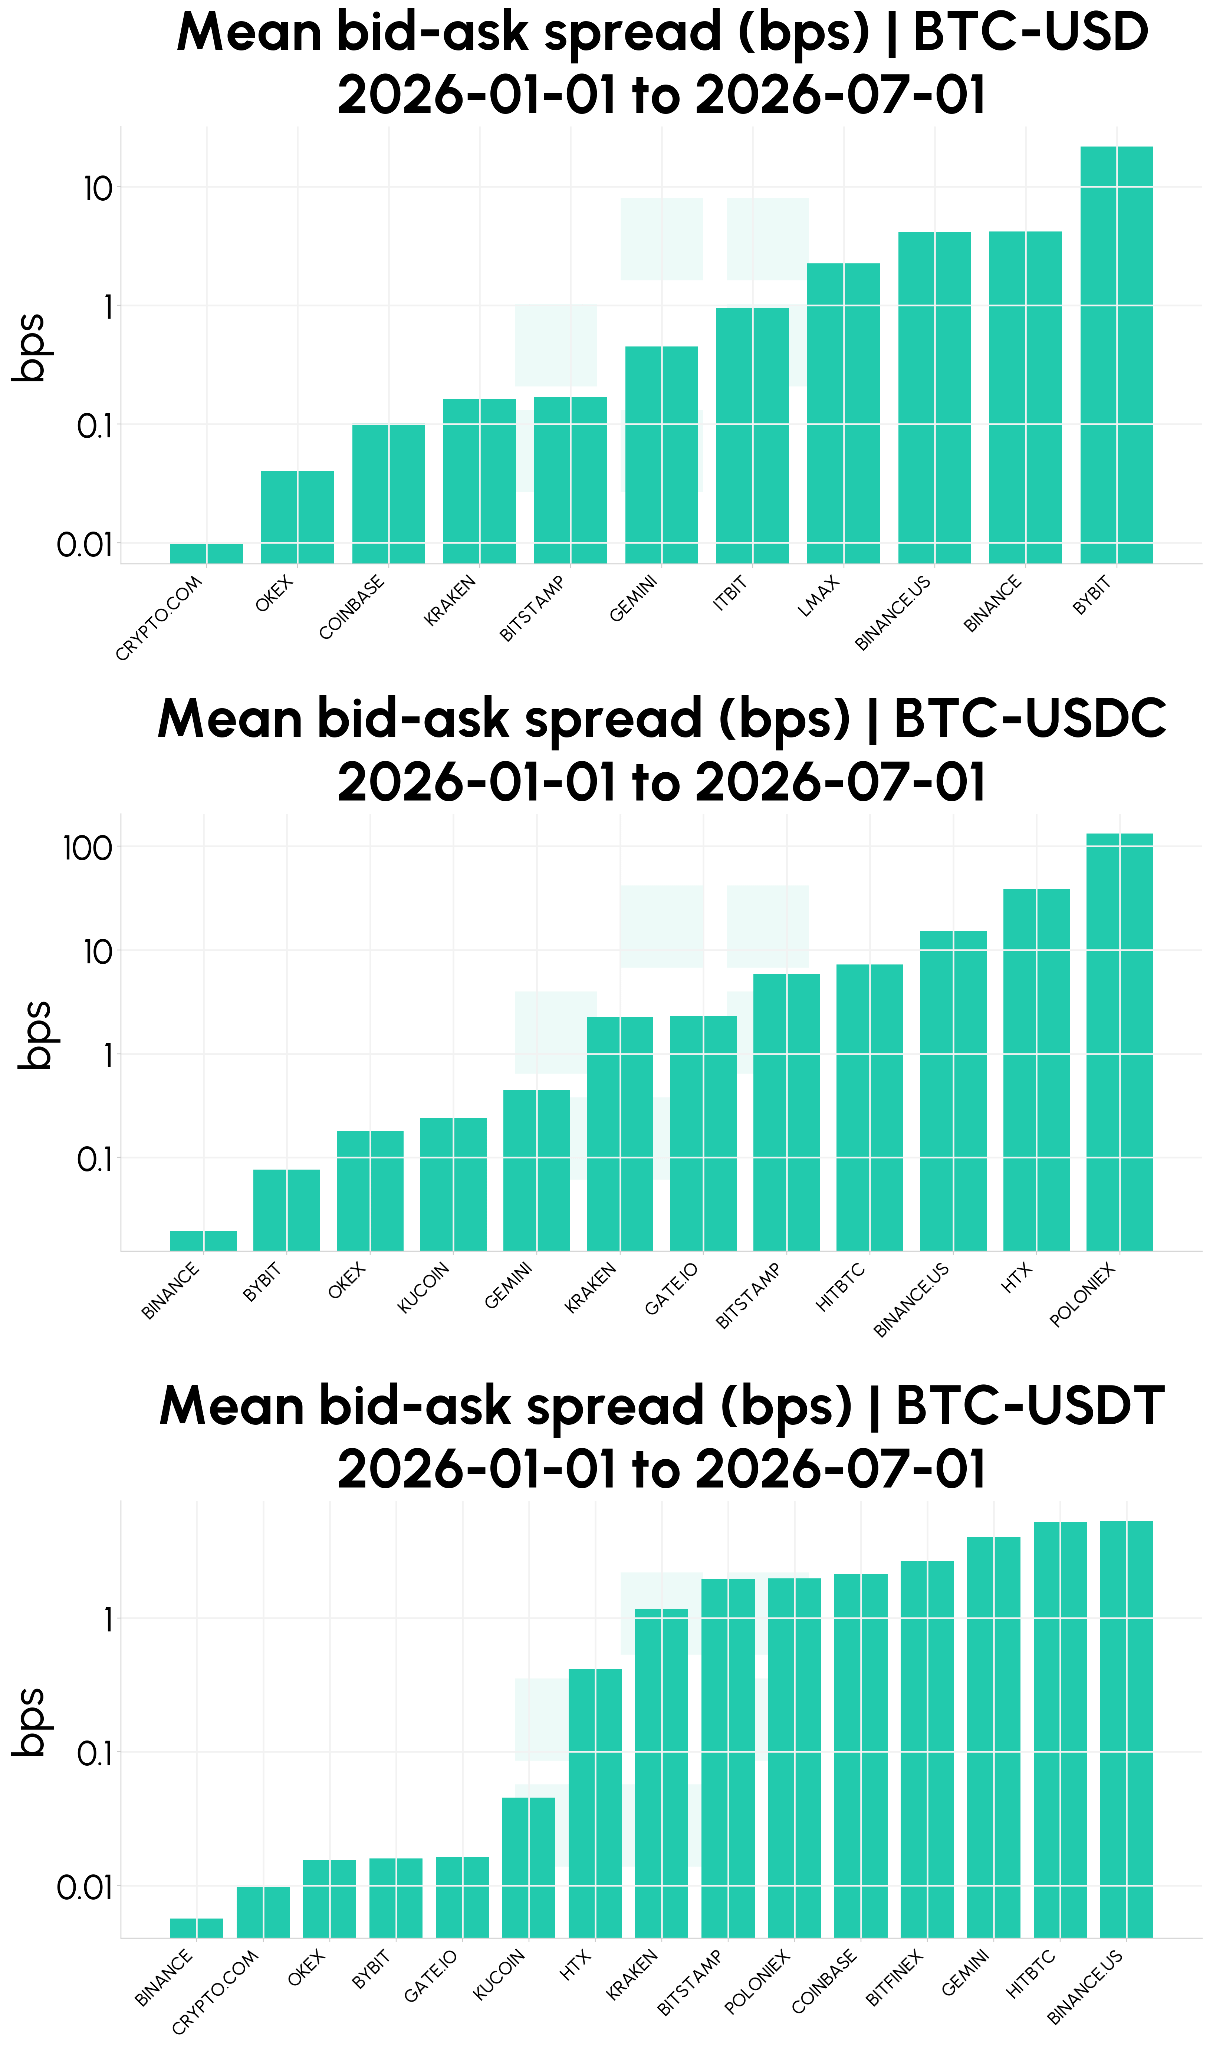
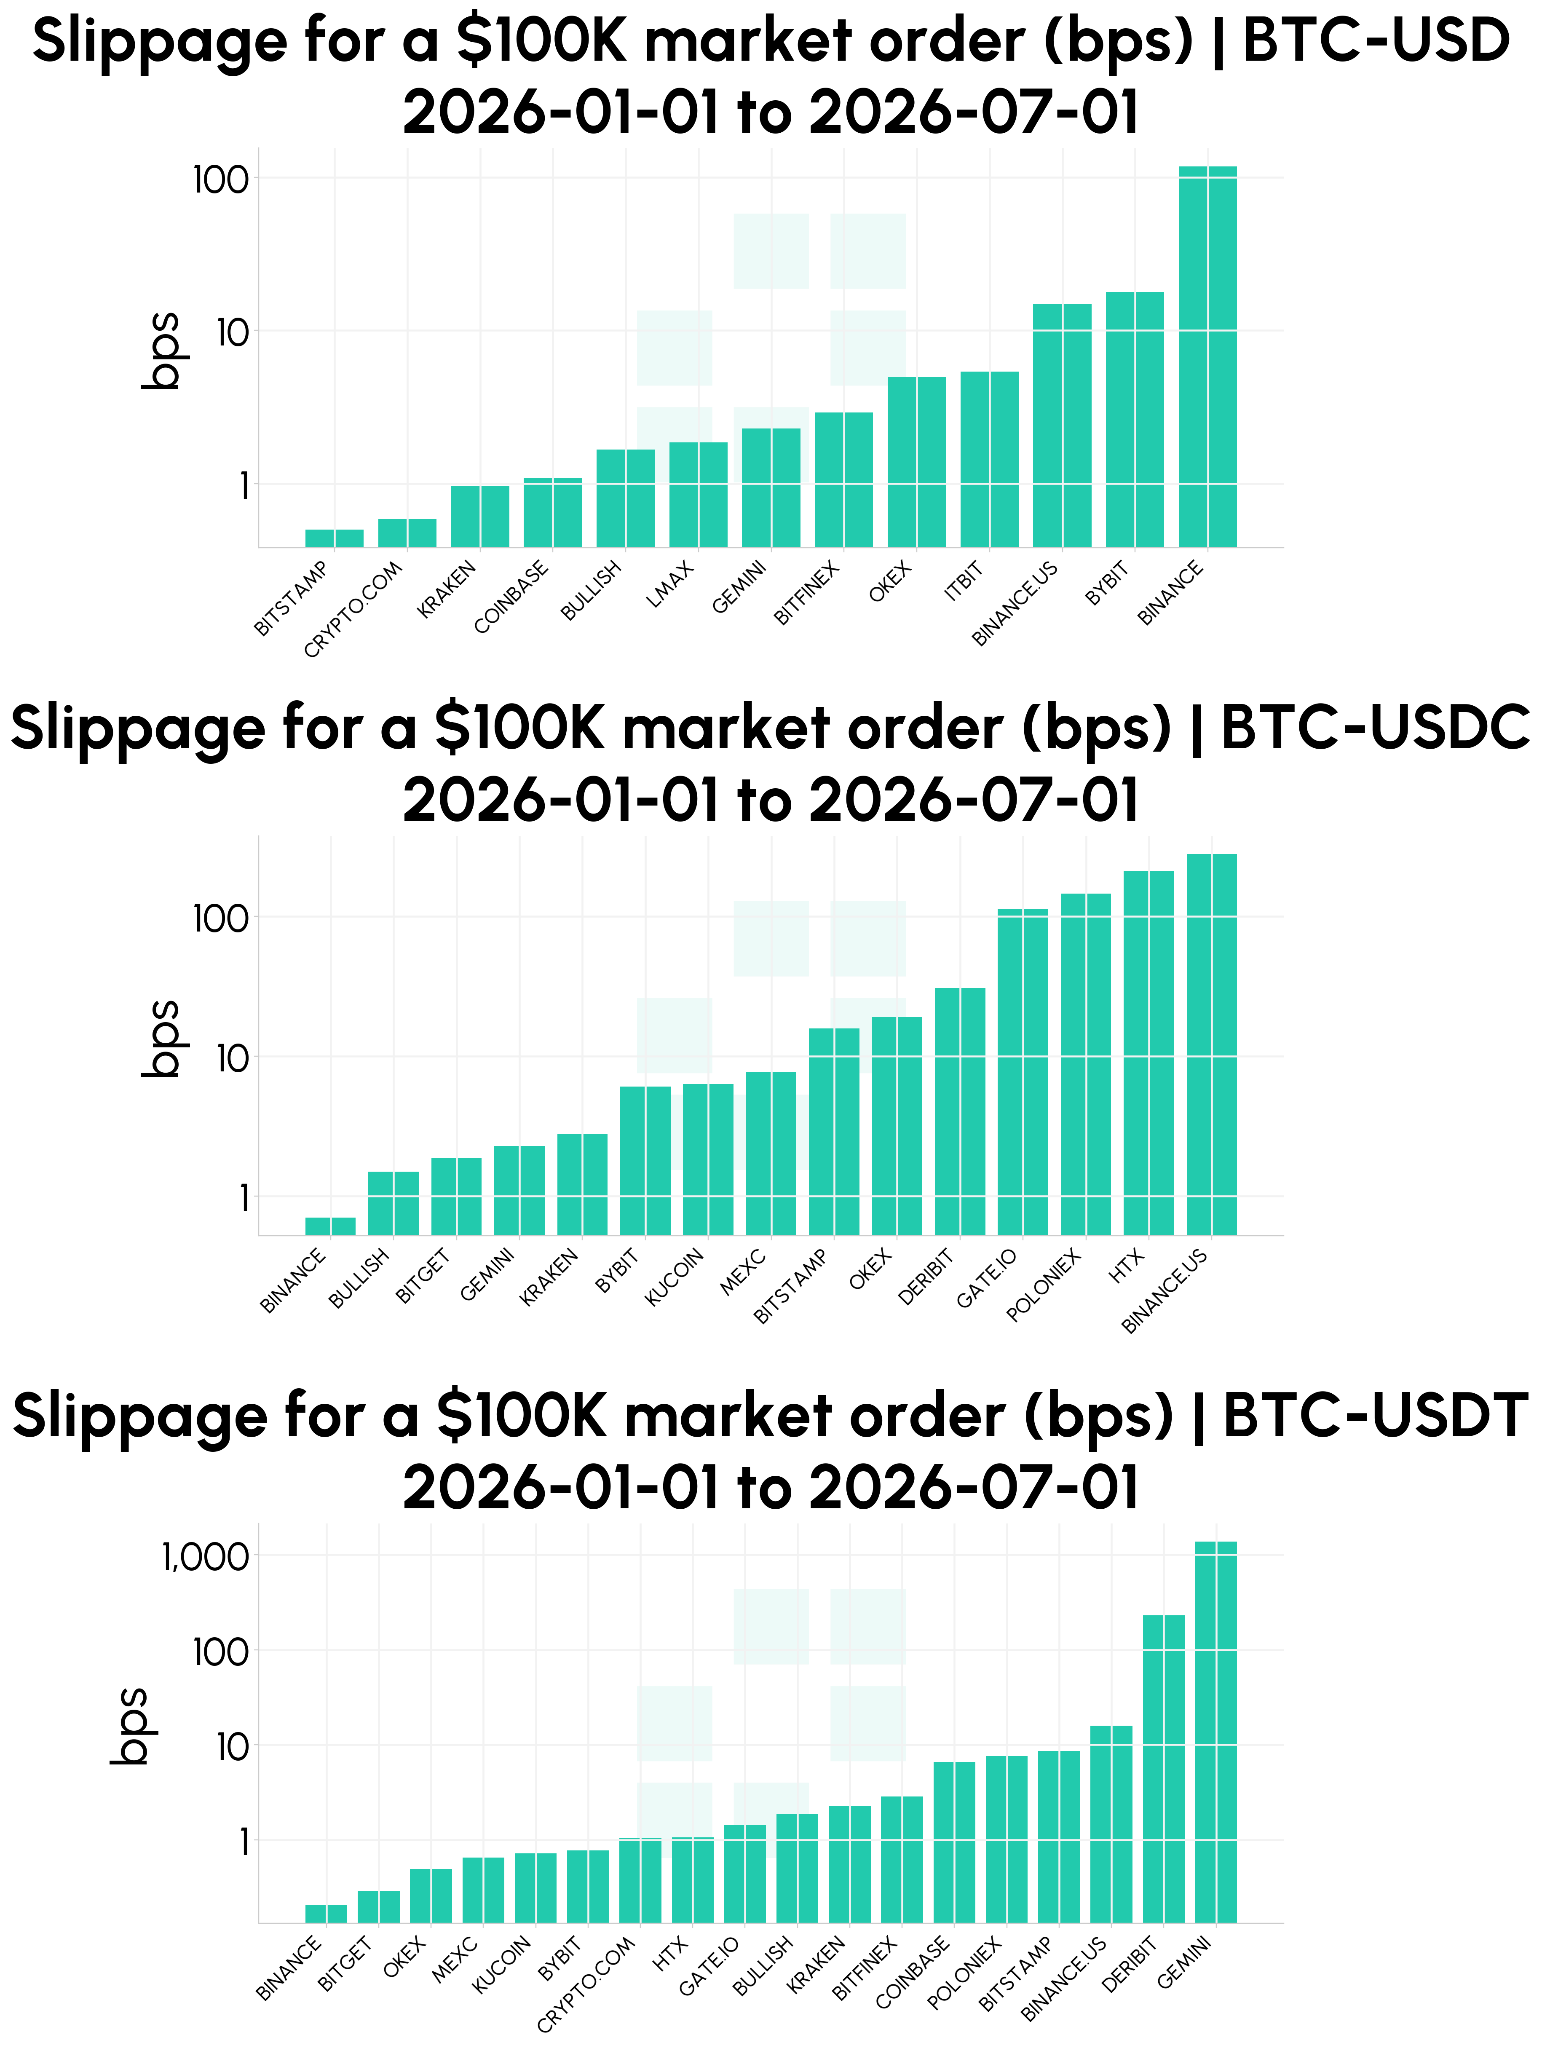
In general, spread and slippage agree with each other for most markets. There is a wide continuum of execution quality spanning venues and trading pairs, and there is no unanimous venue for which the cheapest execution occurs.
Orderbook Depth to Volume
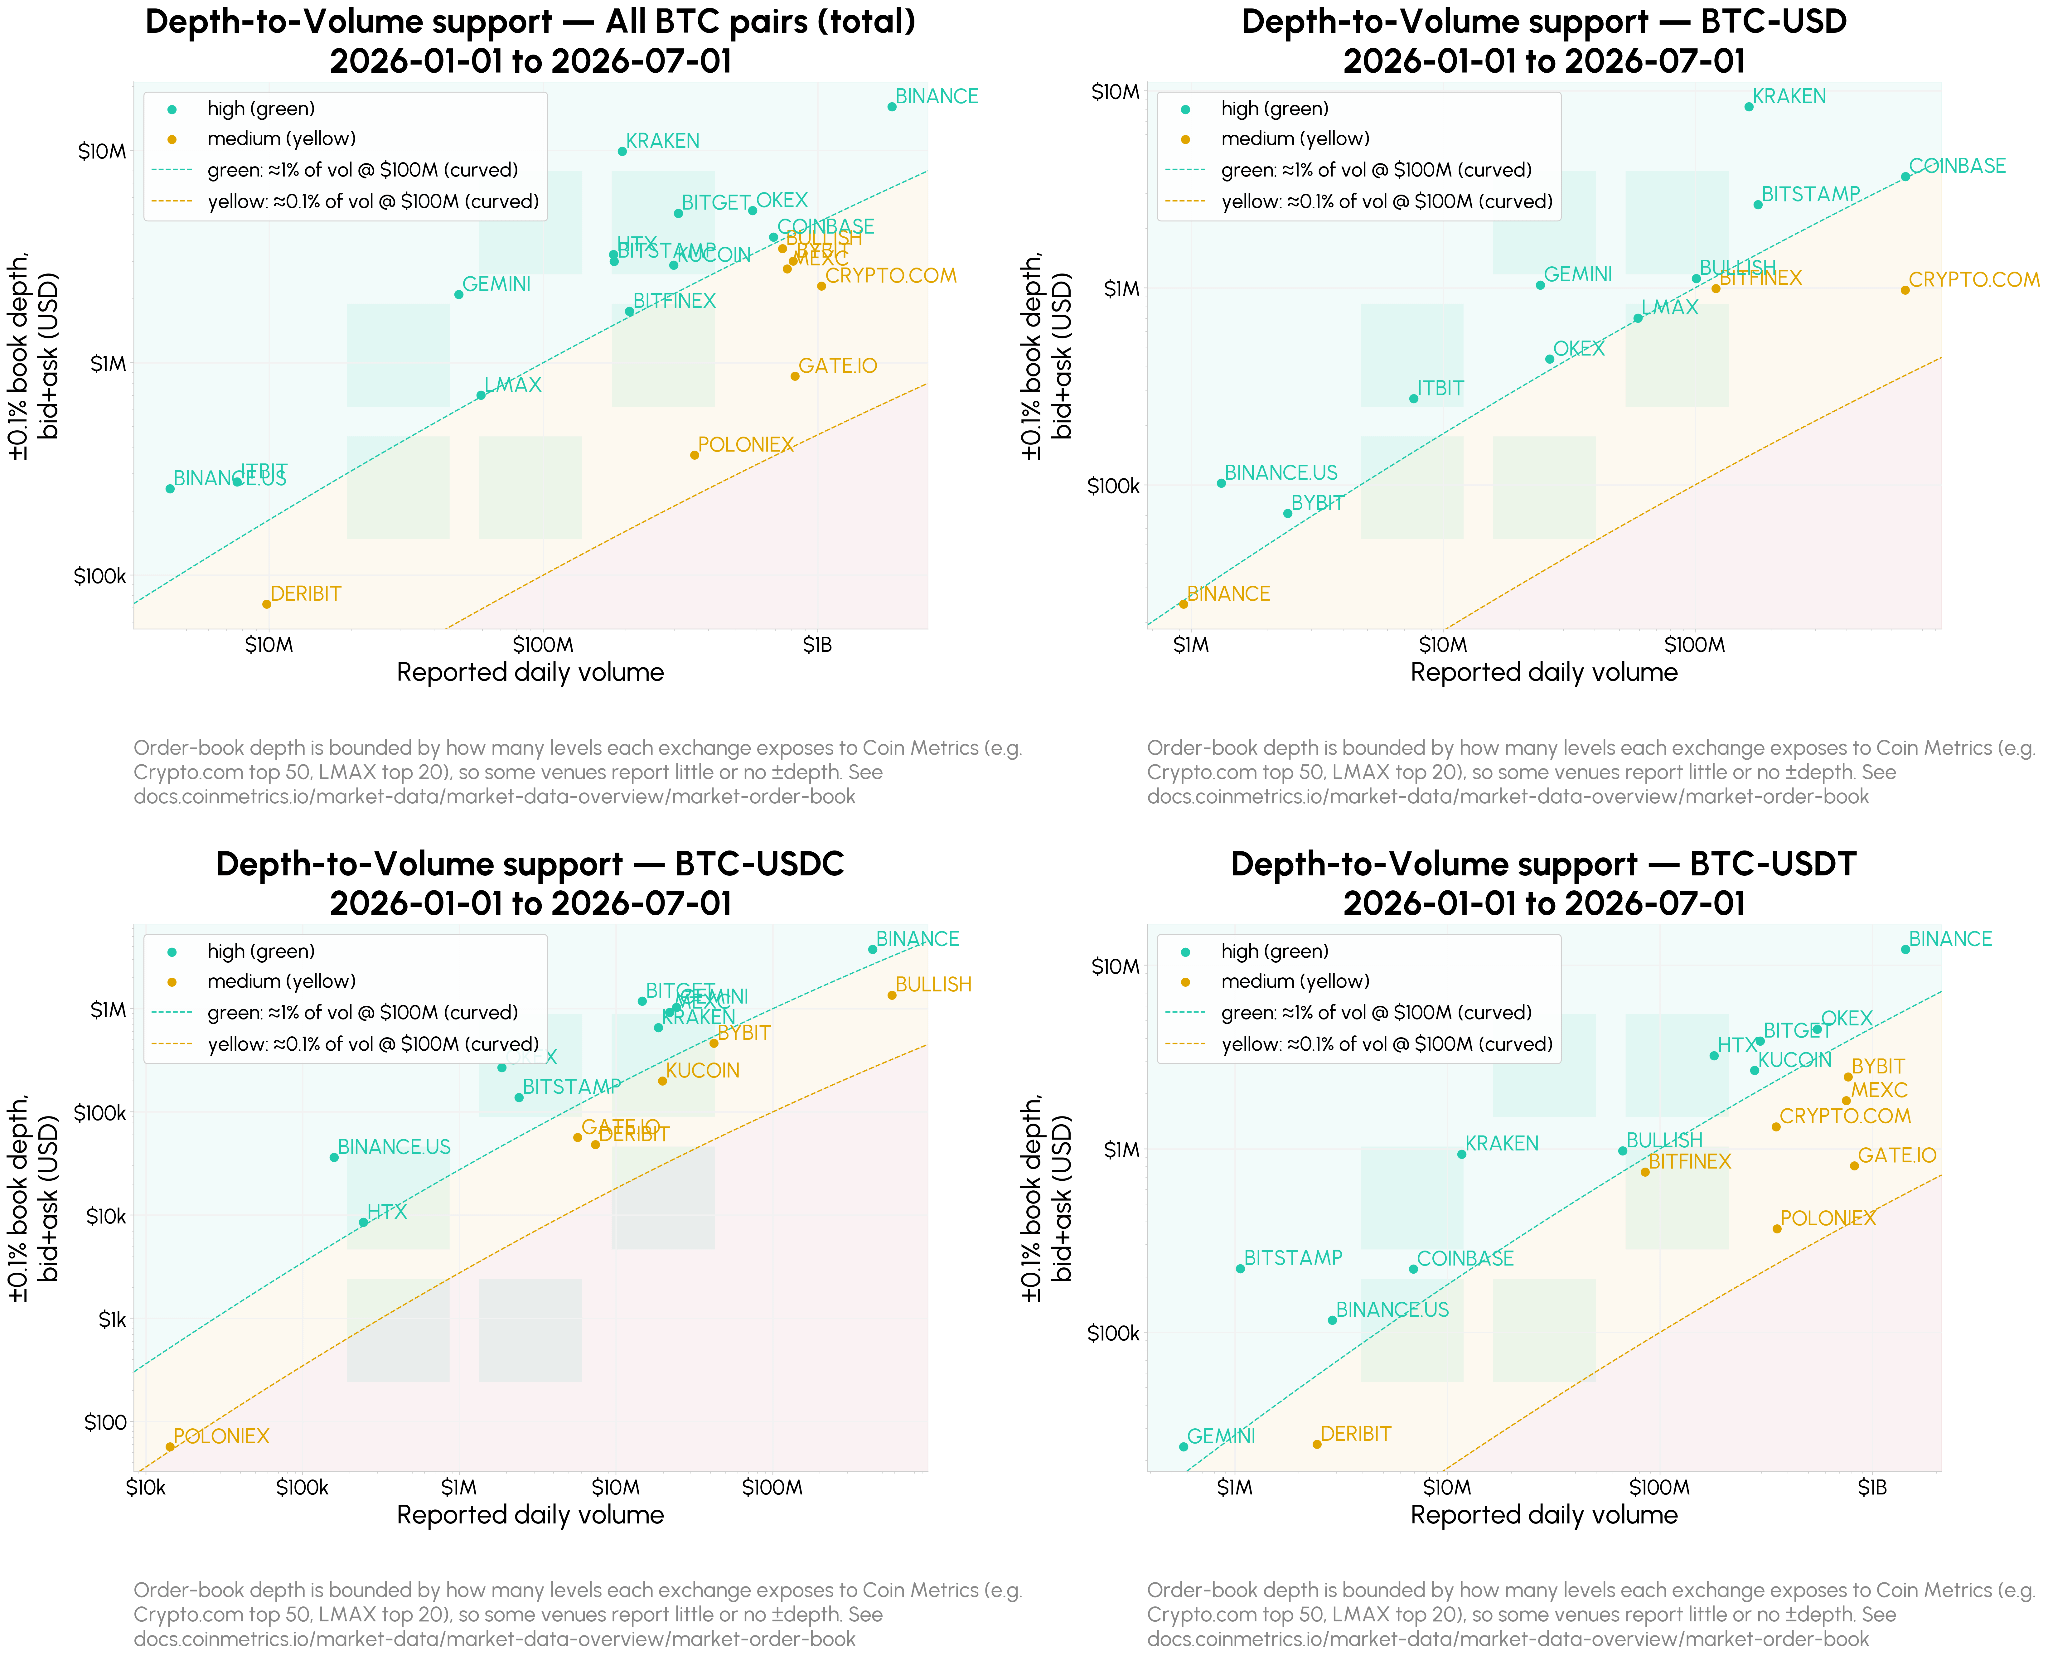
The last liquidity measure is the ratio between orderbook depth (“resting volume”) and trading volume (“active volume”). The depth-to-volume ratio tells us how much liquidity is backing the trading volume seen in exchanges. Trading volumes are expected to be proportional to orderbook depth; when trading volume is high, deep resting liquidity absorbs sudden order flow without large price moves, which matters most in high-volatility periods.
To illustrate this comparison across exchange liquidity regimes, we plotted the reported daily volume versus orderbook depth. The support line is anchored at $100M in trading volume (x-axis) per $1M of bid + ask depth within 0.1% of the mid-price (y-axis). Exchanges above that support line have relatively deep orderbooks behind observed trading volume compared to exchanges below that support line.
Wash-Trading
In order to maintain the integrity of our volume metrics and reference rates, we filter out exchanges which we detected to have strong signals of wash-trading. More information about the techniques the Talos Research team uses to detect wash-trading can be found in the methodology and in past issues. In this section, we’ll highlight a small example of exchanges’ distribution of trade sizes – the frequency of trades executed at specific amounts.
Trade Size Histograms
One of the earliest notable studies for fake volume was the Bitwise paper (2019), in which it examined the trade size distribution to infer suspicious trading behavior: “Trade Size Histograms for exchanges with suspicious volume look completely different, and showcase patterns that are both idiosyncratic and highly suspicious.”
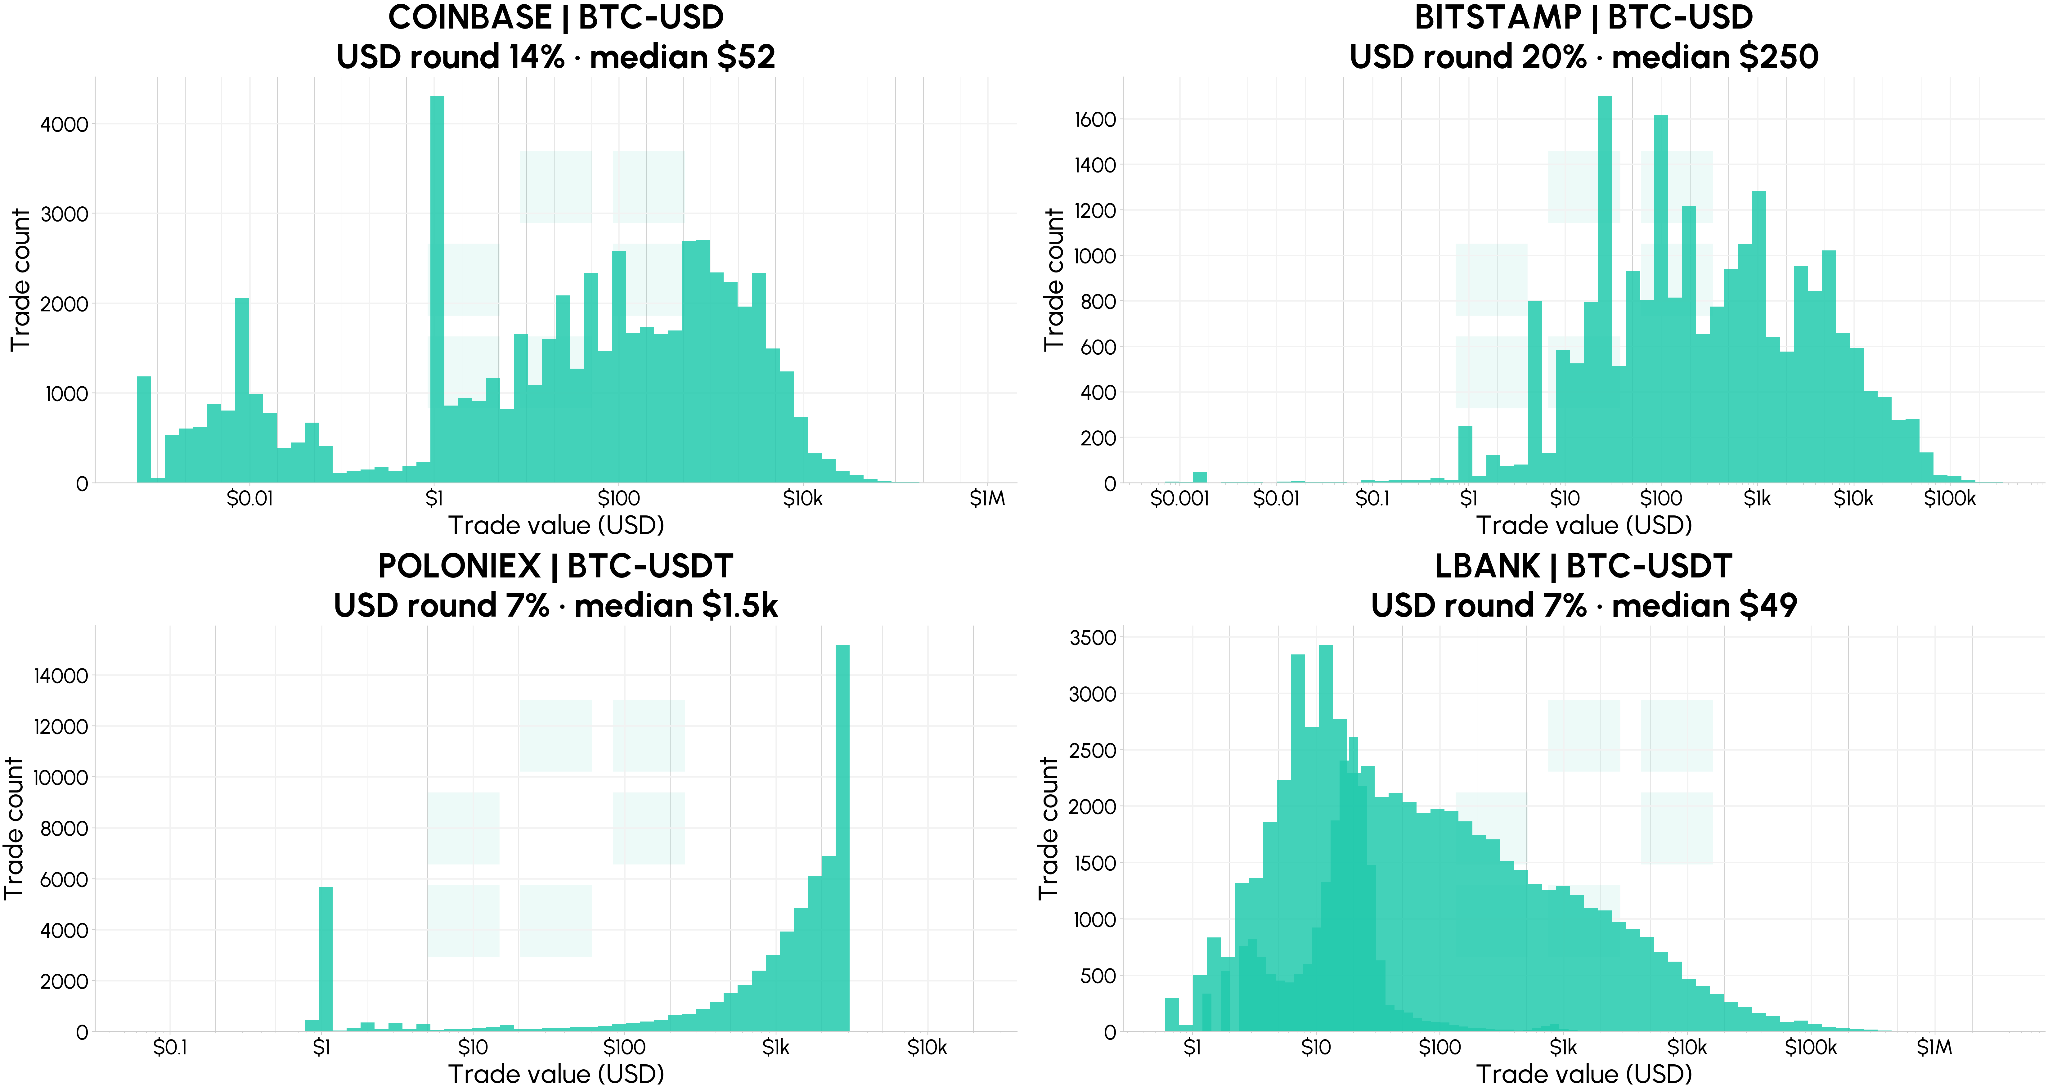
On the top row, we have Coinbase and Bitstamp BTC-USD markets whose trades follow organic market activity: roughly log-normal with large spikes in round numbers ($1, $100, $l,000). Most markets (not shown) in regulated exchanges follow this distribution. This distribution can be reasonably inferred to be typical noise from the market. In contrast, we observe divergent distributions from Poloniex and LBank. Trades on Poloniex show a smooth monotonically increasing trend with an inexplicable cliff at a trade size of ~$2k. Notably, the median trade size at Poloniex is $1,500, far greater than every market we examined. LBank’s distribution exhibits a contrasting but similarly unusual pattern. The trade sizes follow a log-logistic distribution with trades >$10 following a smooth decreasing trend.
View the Talos Exchange Scorecard
Coldcard Attack
Coldcard, a popular Bitcoin hardware wallet used to self-custody BTC, was discovered to have a security vulnerability last week. Some Coldcard wallets incorrectly used a predictable random number generator to create seed phrases in its firmware, making these wallets susceptible to being hacked. Attackers exploited this flaw to drain funds from wallets.
The Coldcard Attack Visualized
While the incident remains ongoing, the vulnerability has been exploited across four different waves draining BTC from affected wallets into collector addresses. Galaxy Research identified over 4500 affected addresses and more than 1800 BTC swept (roughly $110M) as of August 3rd.
The chart below traces the flow of funds into the addresses where funds are being consolidated using Coin Metrics ATLAS. In the first wave, 1083 BTC was consolidated into just four addresses, while subsequent waves show fragmentation into hundreds of destination accounts.
Flight to Custody?
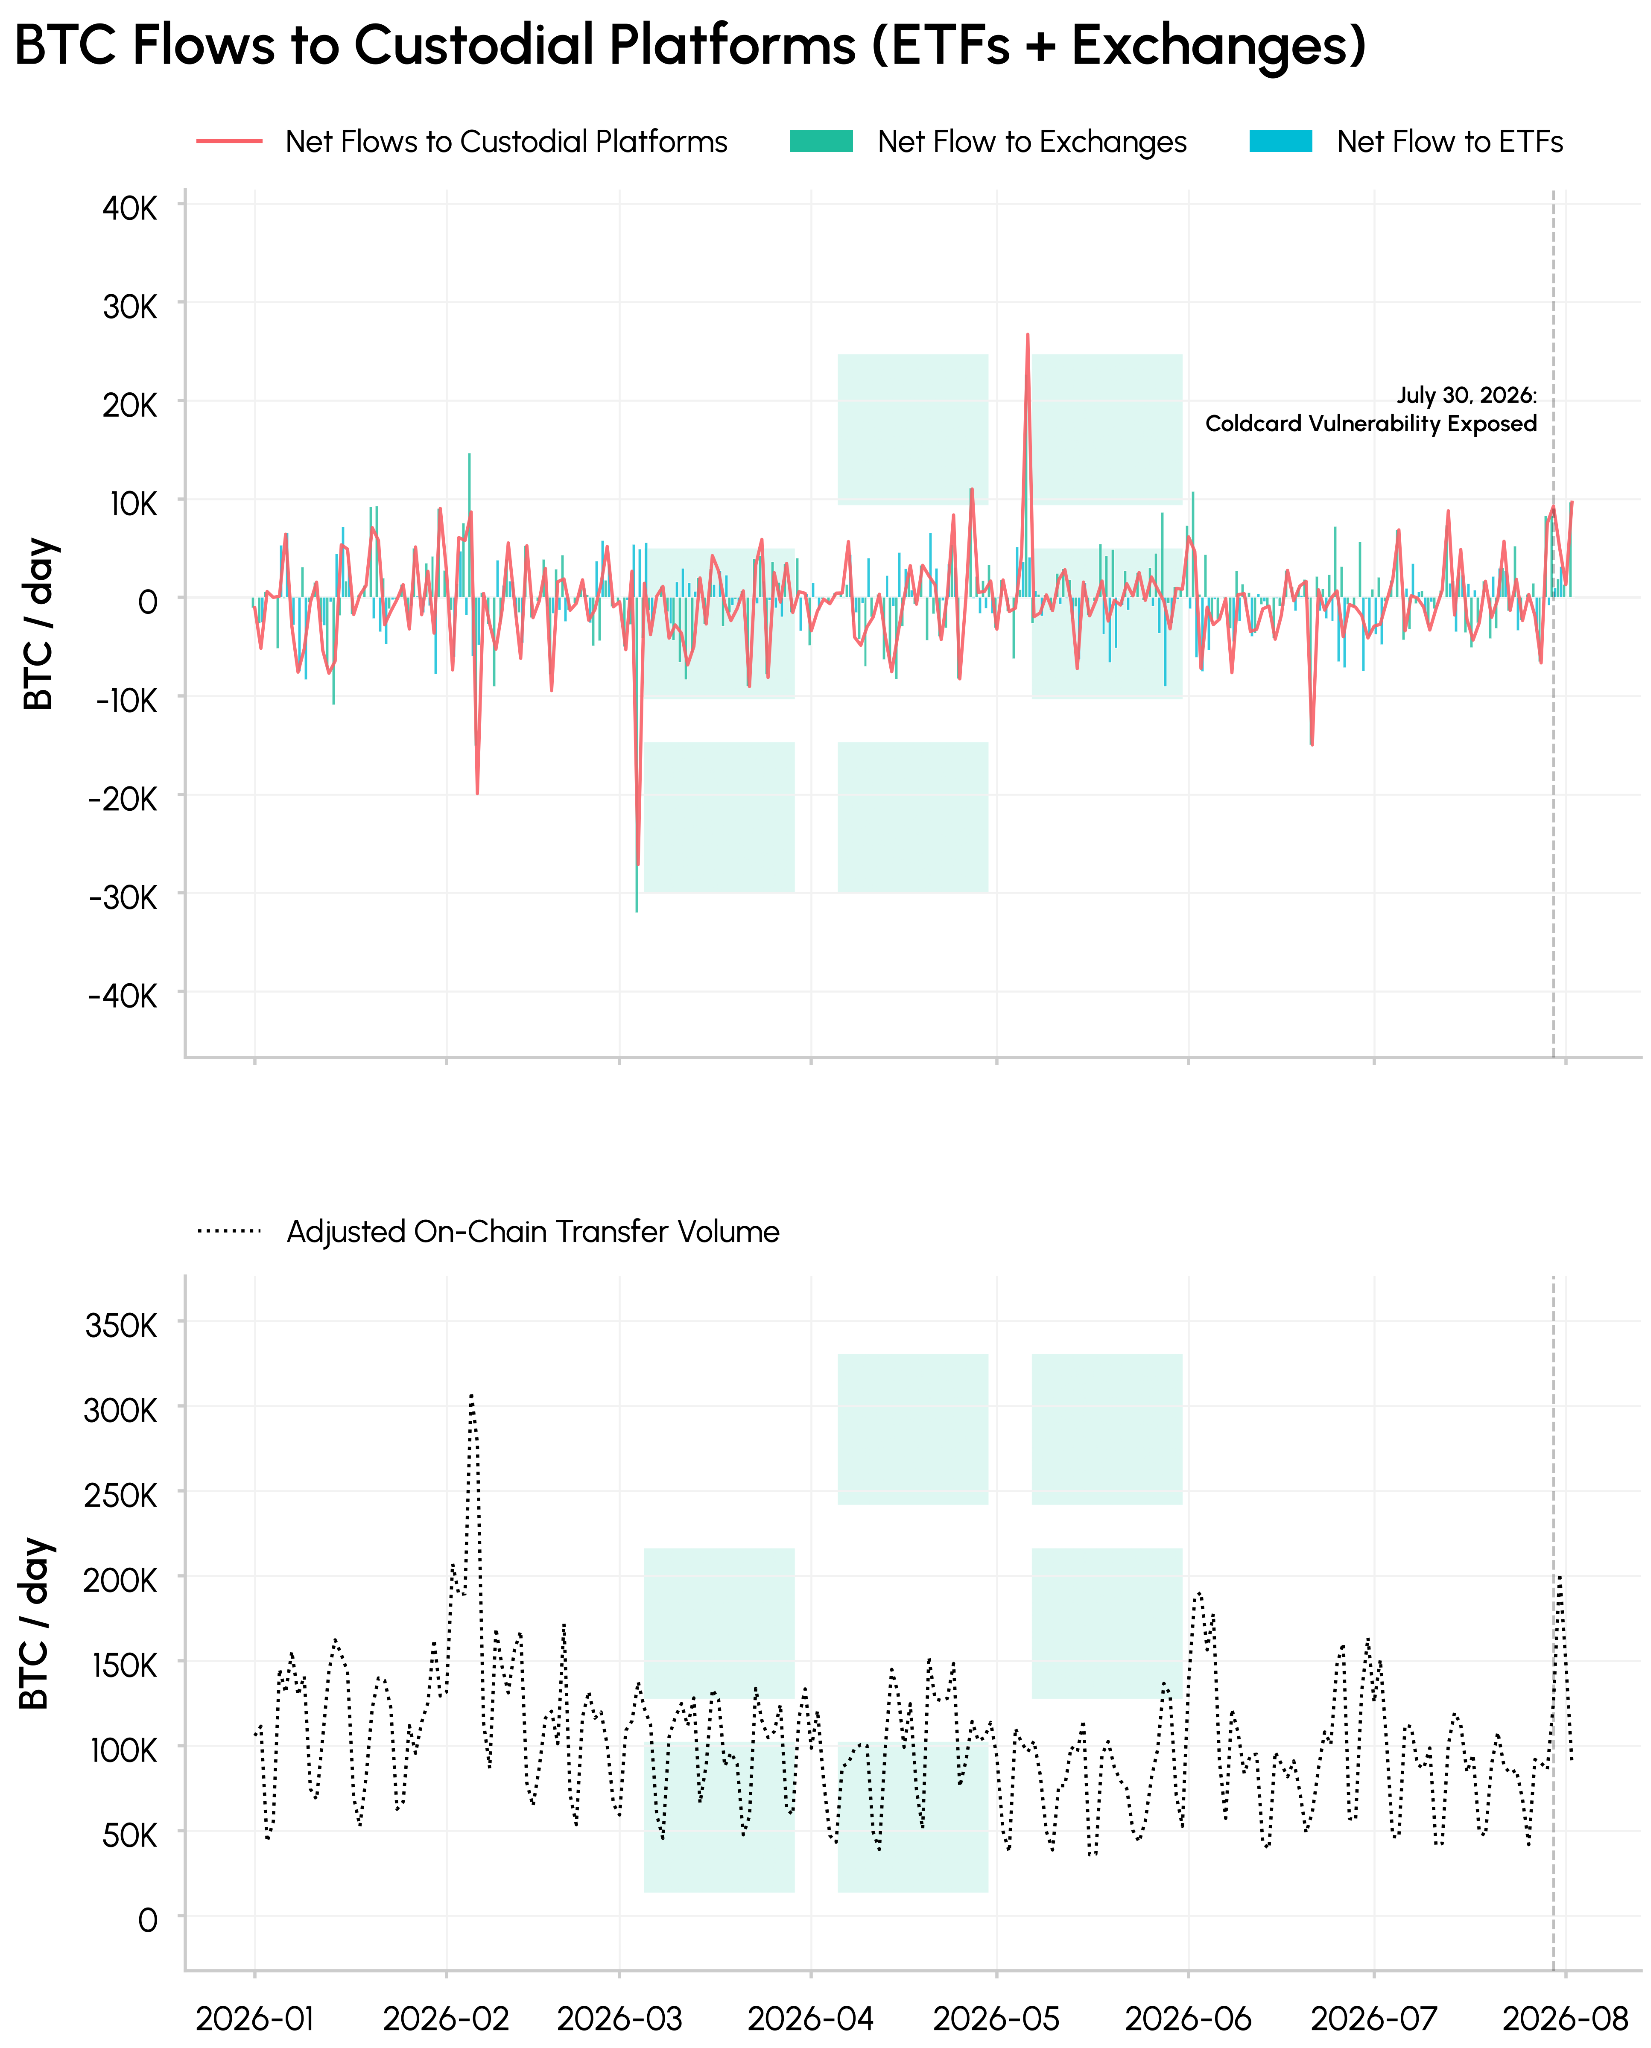
The exploit raised questions about the safety and soundness of cold storage wallets. But do we see an exodus from cold storage to custodial platforms?
Source: Talos CM Network Data Pro
The day after the exploit was reported, about 10,000 net BTC flowed into exchanges. By on-chain transfer volume, about 200k BTC moved, the third most observed on-chain this year. It’s difficult to attribute how much of this is due to the “Coldcard Effect”, but even adjusting for noise, the footprints of this attack are noticeable on-chain.
In 2025, River estimated about half of BTC (or 10 million total) rests in custodial platforms through ETFs or exchanges and the other half in self custody. Although the ~1,800 Bitcoin directly accounted for in this attack represents a relatively small share, much of the collateral damage may yet be realized, and user preferences take time to materialize. Leaving bitcoin in exchanges exposes holders to a different set of risks. Ultimately, no custody set up is 100% secure.
Subscribe and Past Issues
Coin Metrics State of the Network is an unbiased, weekly view of the crypto market informed by our own network (on-chain) and market data.
If you’d like to get State of the Network in your inbox, please subscribe here. You can see previous issues of State of the Network here.
Disclaimer: The information herein is provided for informational purposes only. Talos Trading, LLC and its affiliates (“Talos”) does not give any representations or warranties in relation to the accuracy, validity, or completeness of the information of this material, including without limitation the factual information obtained from publicly available sources considered by Talos to be reliable at the time. Talos accepts no liability for any consequences of using the information contained in this material. Any opinions or estimates expressed herein reflect a judgment made by the author(s) as of the date of publication and are subject to change without notice. Neither this material nor any copy thereof may be taken, reproduced, or redistributed, directly or indirectly, without Talos’s prior written permission. Any views or opinions expressed are those of the authors and do not necessarily reflect the views of Talos. This communication does not constitute an offer to buy or sell, or a promotion or recommendation of, any digital asset, security, derivative, commodity, financial instrument, or product or trading strategy. This document and information are not intended to constitute investment advice or a recommendation to make (or refrain from making) any kind of investment decision and may not be relied on as such.
Subscribe
If you’d like to get State of the Network in your inbox, please subscribe below.
Latest insights and research



Request a demo
Find out how Talos can simplify the way you interact with the digital asset markets.