

State of the Market: Markets absorb a record hack and the midterms
State of the Market | Oct 29 – Nov 4th, 2026
State of the Market: Markets absorb a record hack and the midterms

Introduction
State of the Market | Oct 29 – Nov 4th, 2026
Weekly pulse
Markets absorb a record hack and the midterms
Markets absorbed a record exchange hack and the U.S. midterms this week, emerging with less uncertainty and limited signs of contagion. October ended in true spooky fashion, with Binance suffering a $6.3B heist. Yet despite the headlines and historical parallels, rapid asset freezes and Binance’s commitment to cover losses helped keep the aftermath more contained than in past exchange crises.
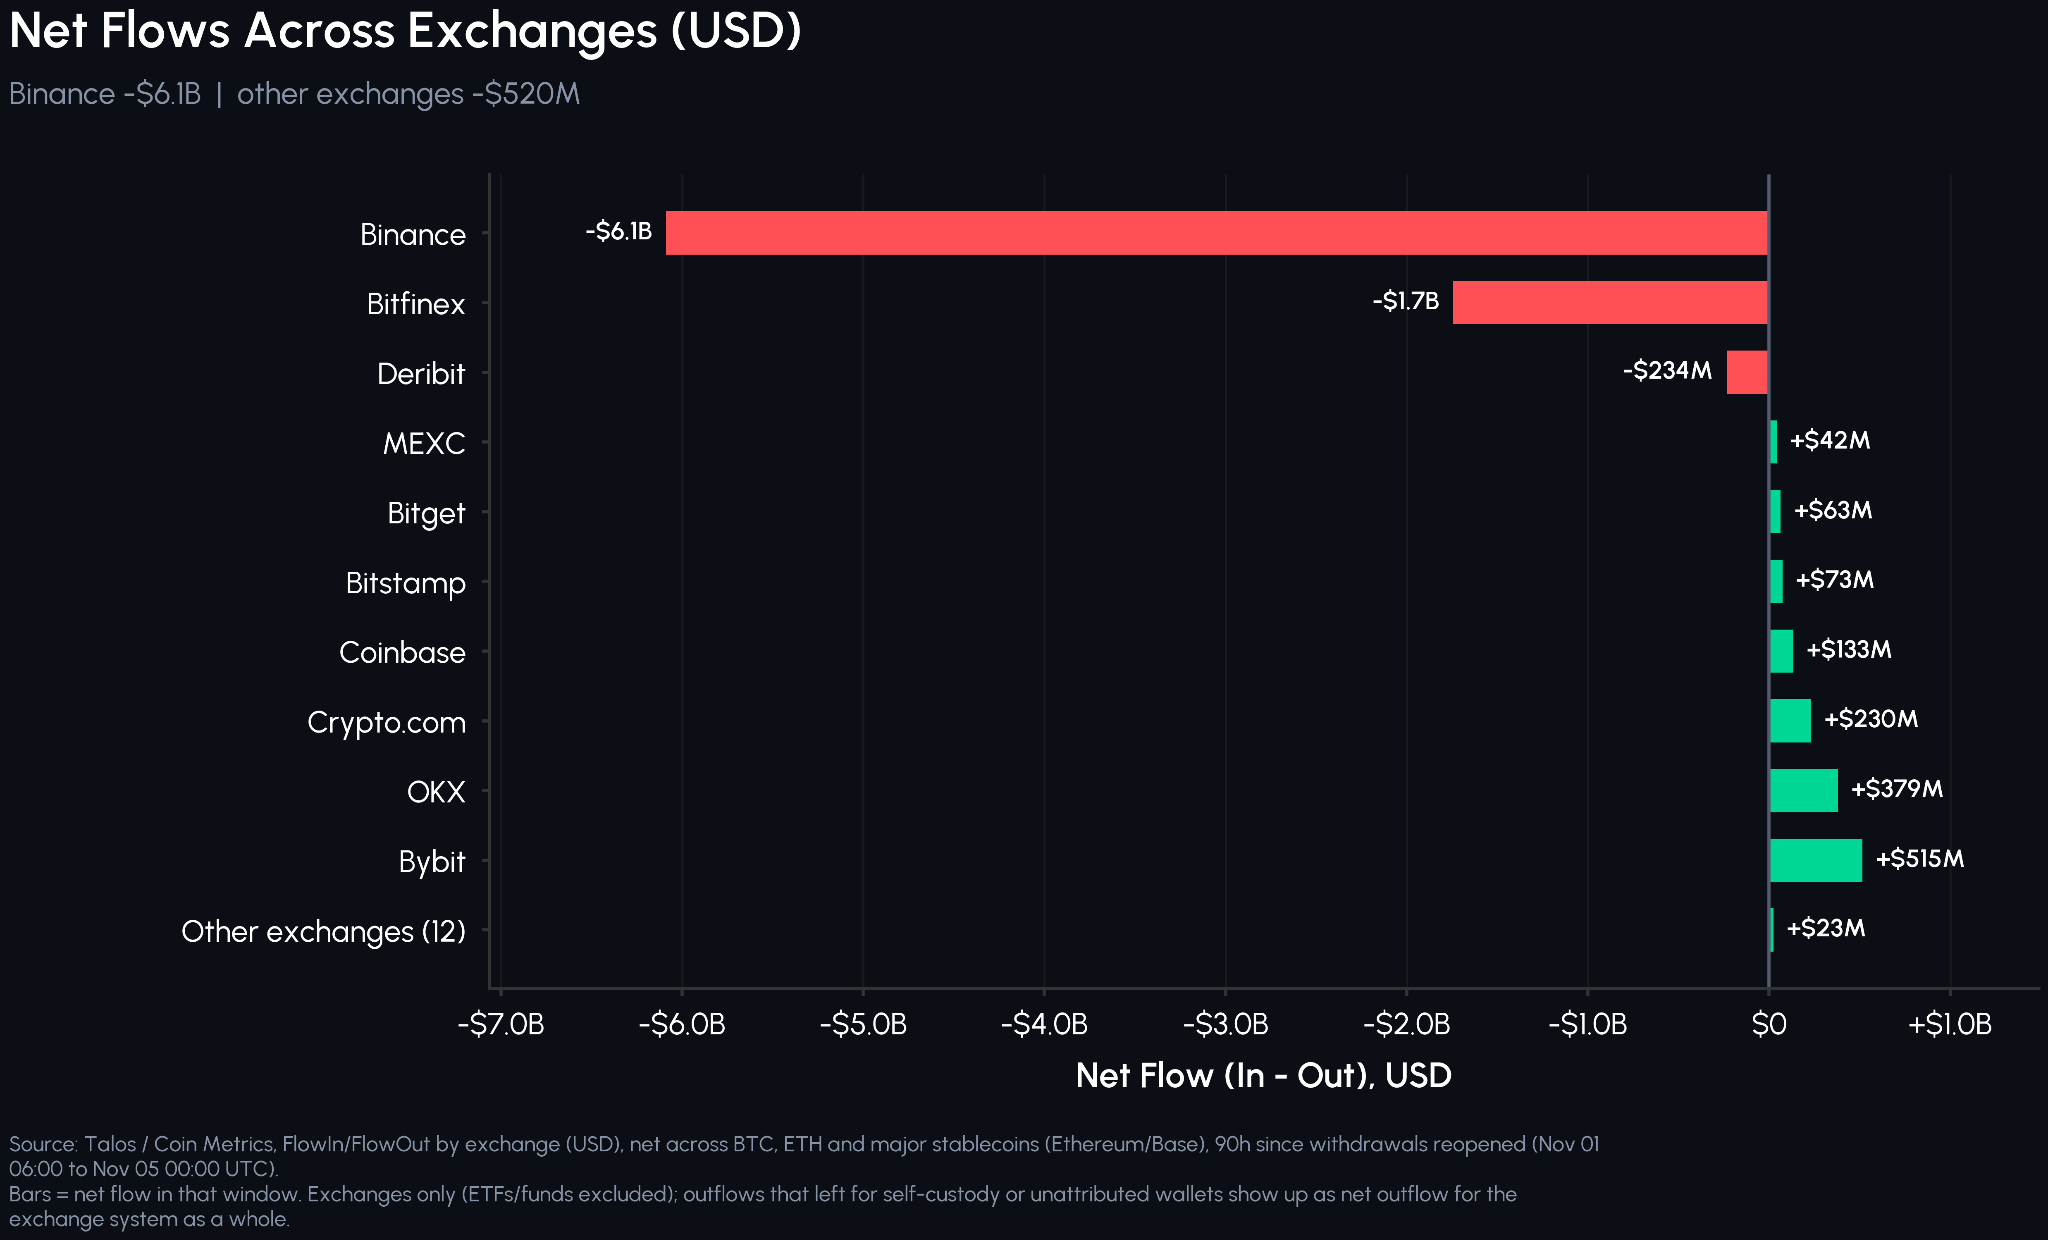
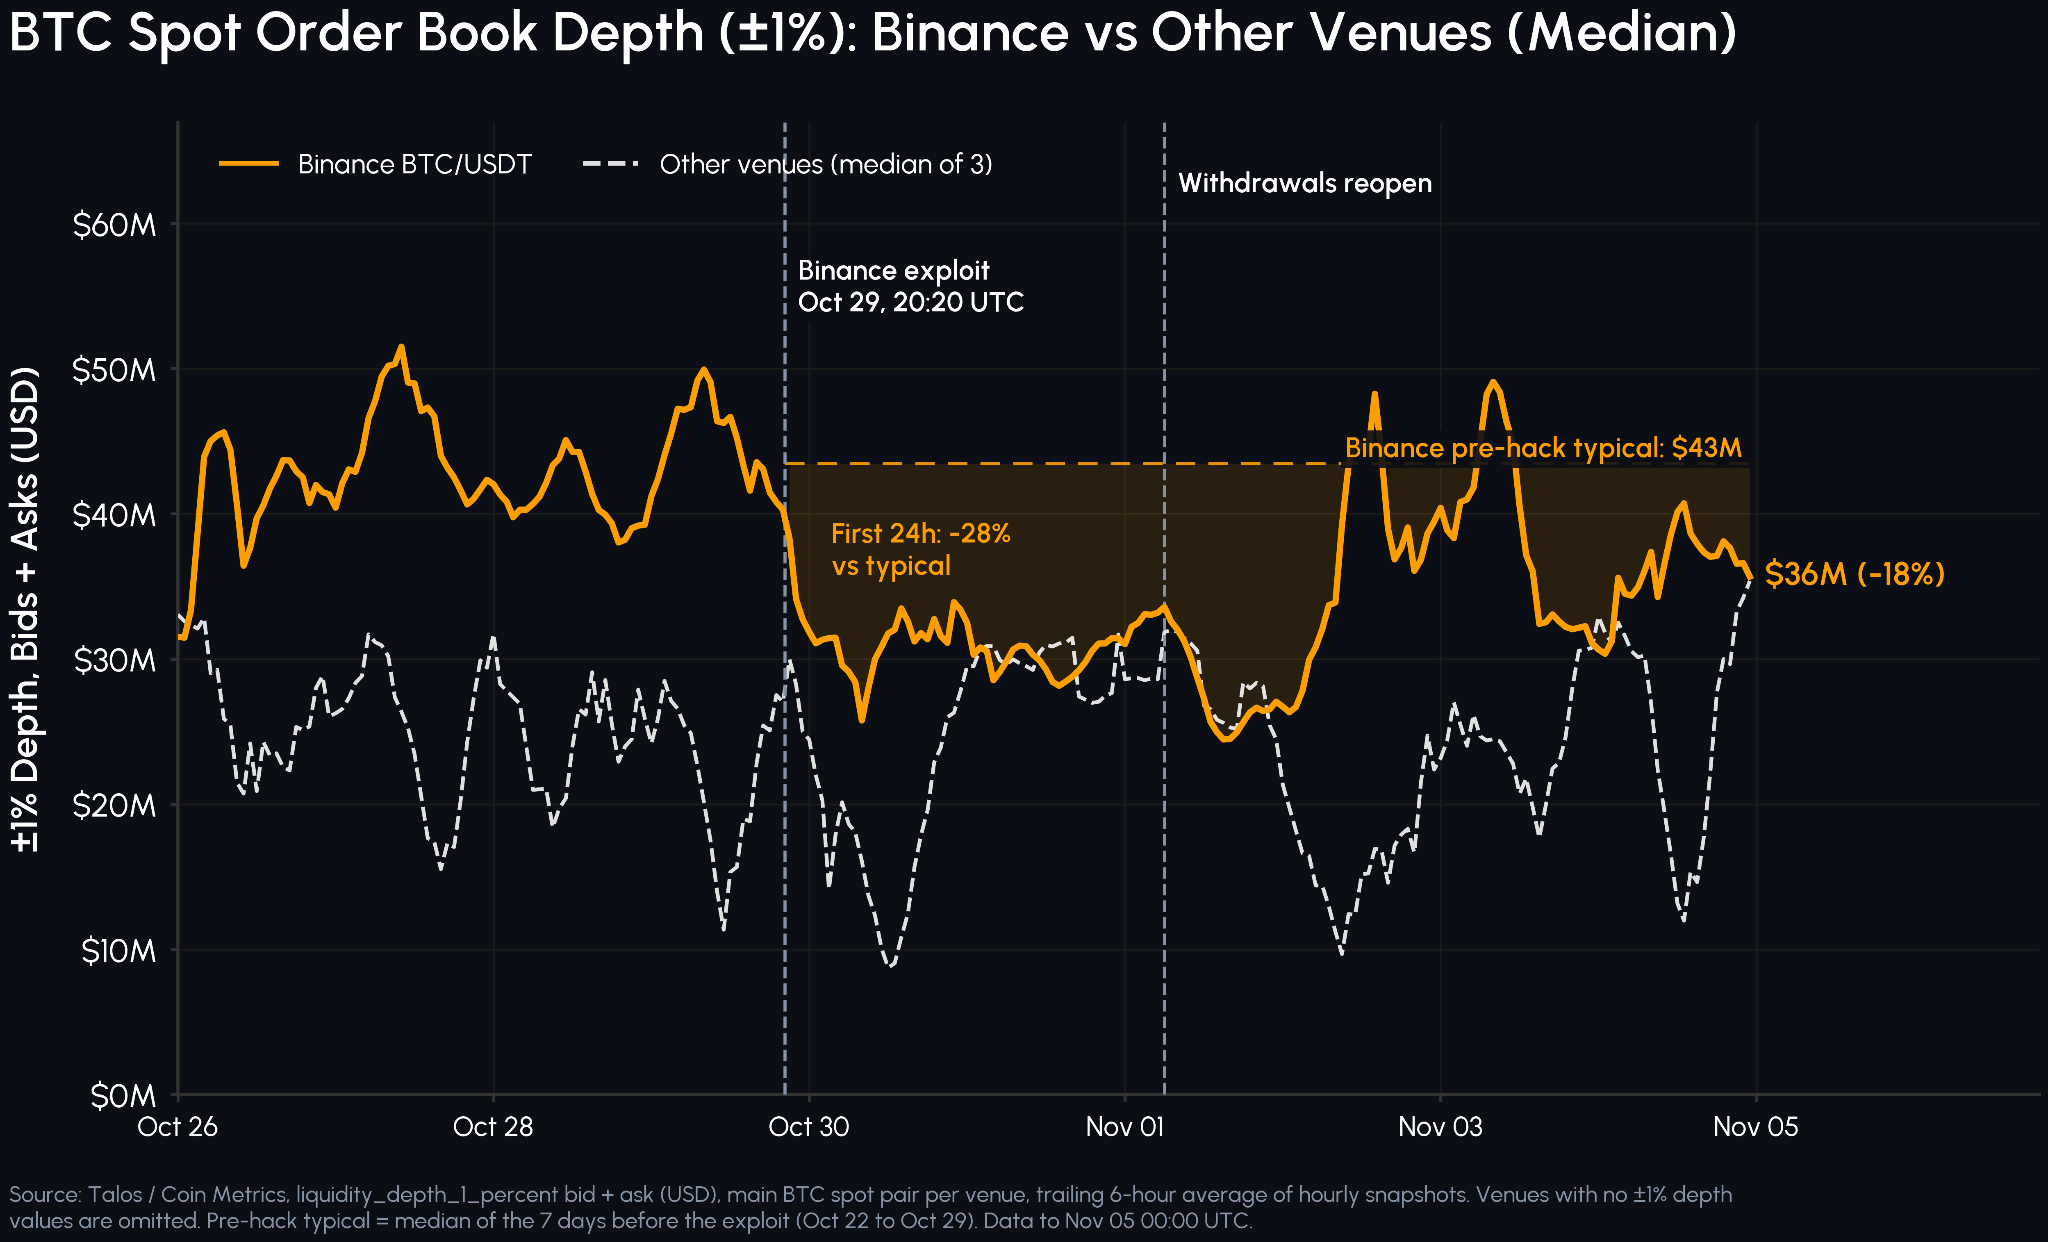
Liquidity took a hit, with Bitcoin depth within 1% on Binance falling about 28% on the first day and about 44% at its low around the November 1st reopening, before recovering. Binance saw net outflows of about $6.1B after resuming withdrawals, which have slowed as deposits returned.
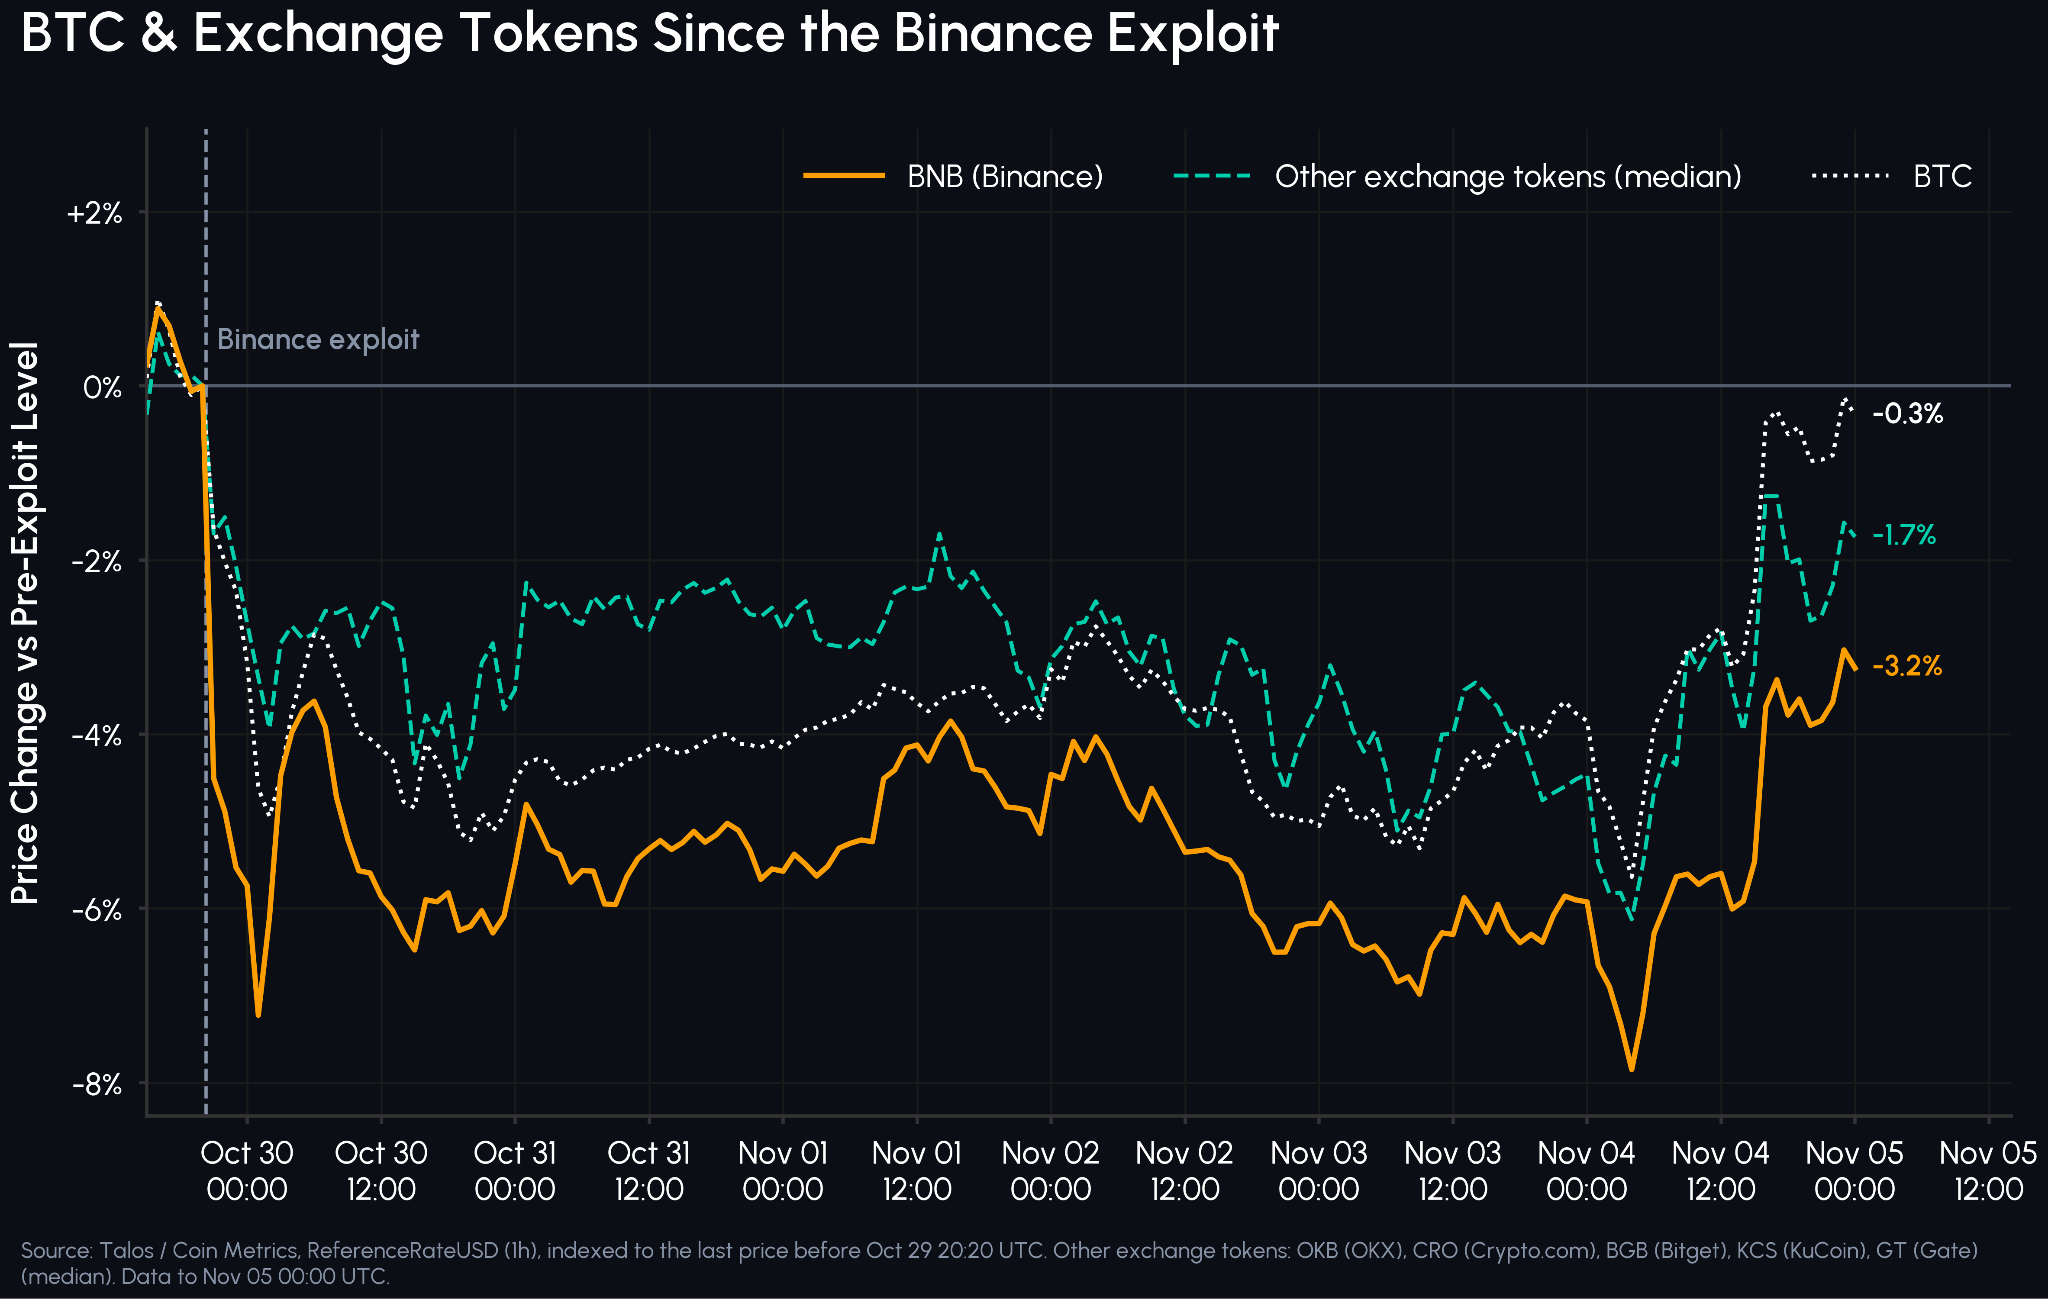
Price action reflected the relative resilience. BTC fell about 5% post hack, in line with broader risk assets against a much steeper decline after FTX’s fallout. BNB is underperforming a basket of five peers and is still showing relative weakness since the hack. The response and partial recovery in liquidity suggest markets treated the event primarily as an operational shock rather than a broader crisis of confidence in exchanges.
Source: Talos Market Data
The midterms then resolved a key source of political uncertainty. As polls closed, Kalshi’s odds of a Democratic sweep went from about 74% at 6pm ET to 99% by 9:01pm ET, before the contract settled around midnight, and Talos’ odds-of-odds indicator, a measure of uncertainty in the odds themselves, fell to near zero.
On-chain equity perps fell into 9–10pm ET as results came in and recovered overnight, before cash markets reopened (see Election Night Through Perps & Prediction Markets below). BTC moved about 1.7%, close to the roughly 1.8% options had priced, and implied volatility reset lower, with BTC DVOL down 6% and the VIX down 10%. With Bitcoin’s 30-day correlation to the Nasdaq-100 elevated (+0.64), its recent weakness reflected broader market jitters, not just the Binance hack.
Market performance
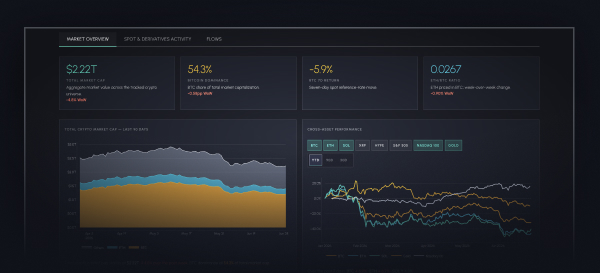
The total crypto market cap stands at $2.79T, down 1.0% over the week, with BTC dominance at 58.0%. Bitcoin fell 0.9%, lagging the S&P 500 (+0.3%) and gold (+1.4%) but holding up better than the Nasdaq 100 (−1.9%).
- Crypto Majors: BTC −0.9% | ETH +2.9% | SOL −6.6%, with ETH/BTC up 3.9% to 0.0301.
- Top Gainer: Monero (XMR) up 7.2%, ahead of Uniswap (+6.1%) and Hyperliquid (+3.9%). Top Loser: NEAR down 15.0%.
- Market Breadth: 7 of the top 50 assets gained (14% advancing), with decliners losing $77.4B of market value against $23.8B added by advancers.
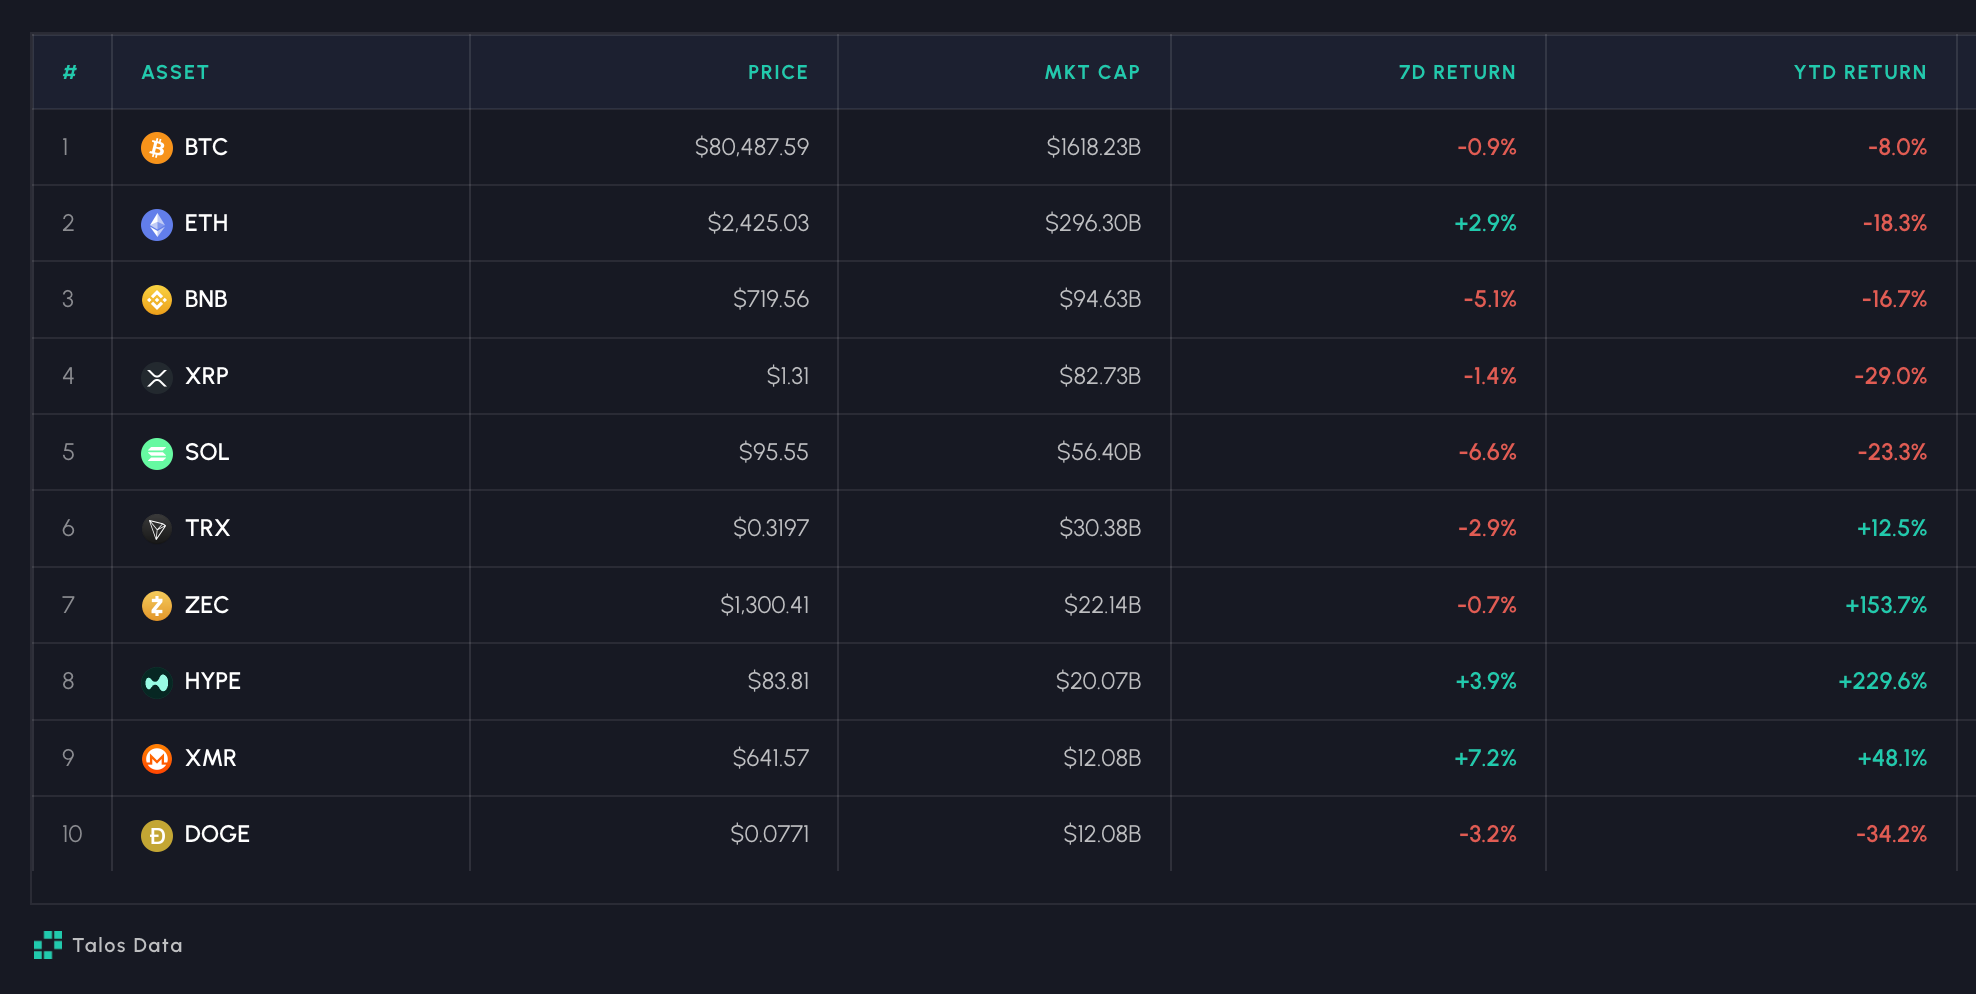
Source: Talos State of the Market Dashboard, Talos CM Market Data (Chart: Performance of the top 10 crypto assets by market capitalization, as of November 4th, 2026).
Flows
- Spot Bitcoin ETFs saw net outflows of $857M over the week, about 4.5x the prior week’s, taking the 30-day total to -$1.29B..
- Stablecoin supply contracted by about $4.9B, driven by USDT (−2.7%) while USDC supply grew 1.0%.
- Exchange Flows: Since Binance reopened withdrawals on November 1st, net flows across exchanges (BTC, ETH and major stablecoins) totalled about −$6.6B, with Binance accounting for $6.1B of it (roughly 92%).
Source: Talos Network Data Pro
Spot & derivatives activity
- Volume: Spot volume rose 18.5% to $177B and futures volume 23.2% to $1.15T. Binance remains the largest venue (27.6% of spot) but lost 2.7pp of share after the hack as others grew faster (OKX +67%, Kraken +48%, Coinbase +47%).
- Leverage & funding rates: BTC open interest fell 3.3% to $44.7B, while funding eased to +8.4% annualized. BTC liquidations totalled $523M over the week to Nov 4, about $450M of it around the hack on Oct 29–30 (mostly longs), with a further $153M of shorts liquidated as Bitcoin rallied after the election.
- Liquidity: BTC depth within 1% fell about 28% on Binance and about 29% across other venues in the first day after the hack. Other venues have since recovered, while Binance remains about 18% below its pre-hack level.
Source: Talos CM Market Data
Election night through perps & prediction markets
The midterms gave us two live readings on election night, both while US exchanges were closed. Prediction markets priced the political outcome, and on-chain equity markets priced how investors reacted to it.
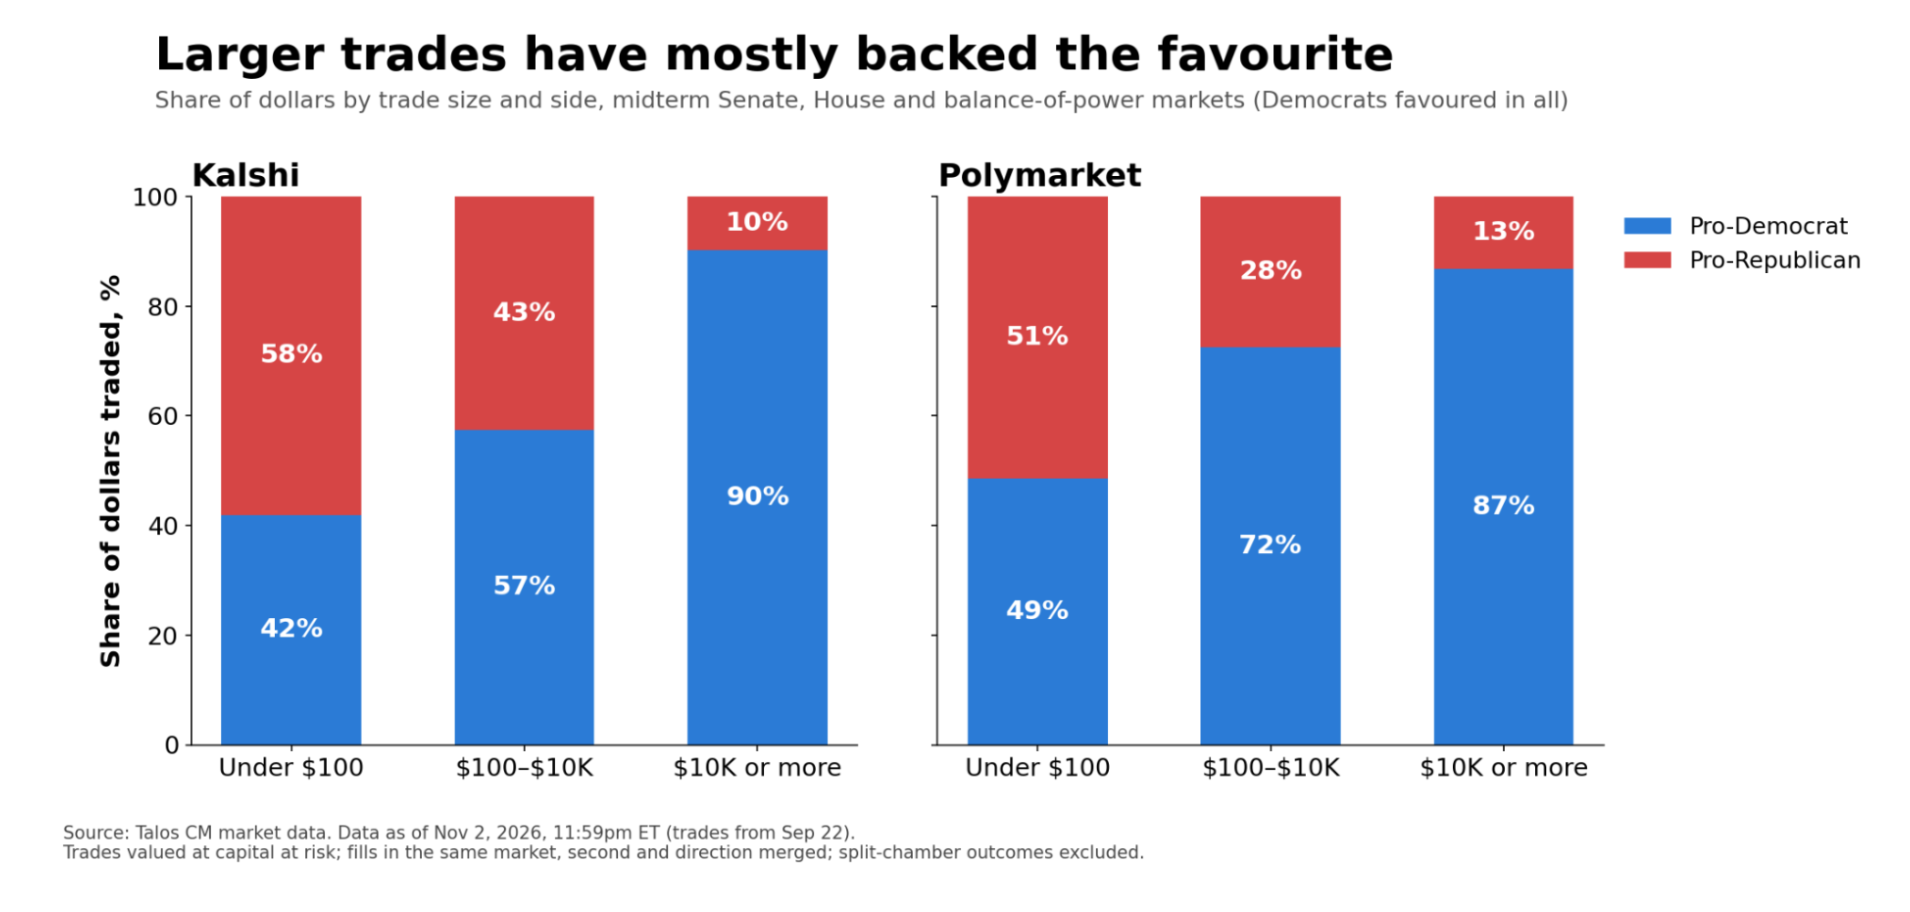
Start with who traded in prediction markets. From Sep 22 to Nov 2, we looked at Senate control, House control and balance-of-power markets, where Democrats were favoured in all of them. On Kalshi, trades under $100 put 58% of their dollars on the Republican side. Trades of $10K or more put 90% on Democrats. Polymarket showed the same pattern: 51% pro-Republican under $100, and 87% pro-Democrat at $10K or more.
The larger the trade, the more likely it backed the outcome the market saw as most likely. Measured in contracts, about 86–90% of trades under $100 were on the Republican side, as small traders bought the cheaper contracts. On Kalshi, 62% of pro-Democratic dollars came from trades of $10K or more, against 17% of pro-Republican dollars. That doesn’t necessarily reflect a party preference. Larger traders tend to back the favourite for a steadier return, while smaller traders lean toward long shots with a bigger payout. The data can’t tell us who these traders are or what their politics are.
Source: Talos CM Prediction Market Data
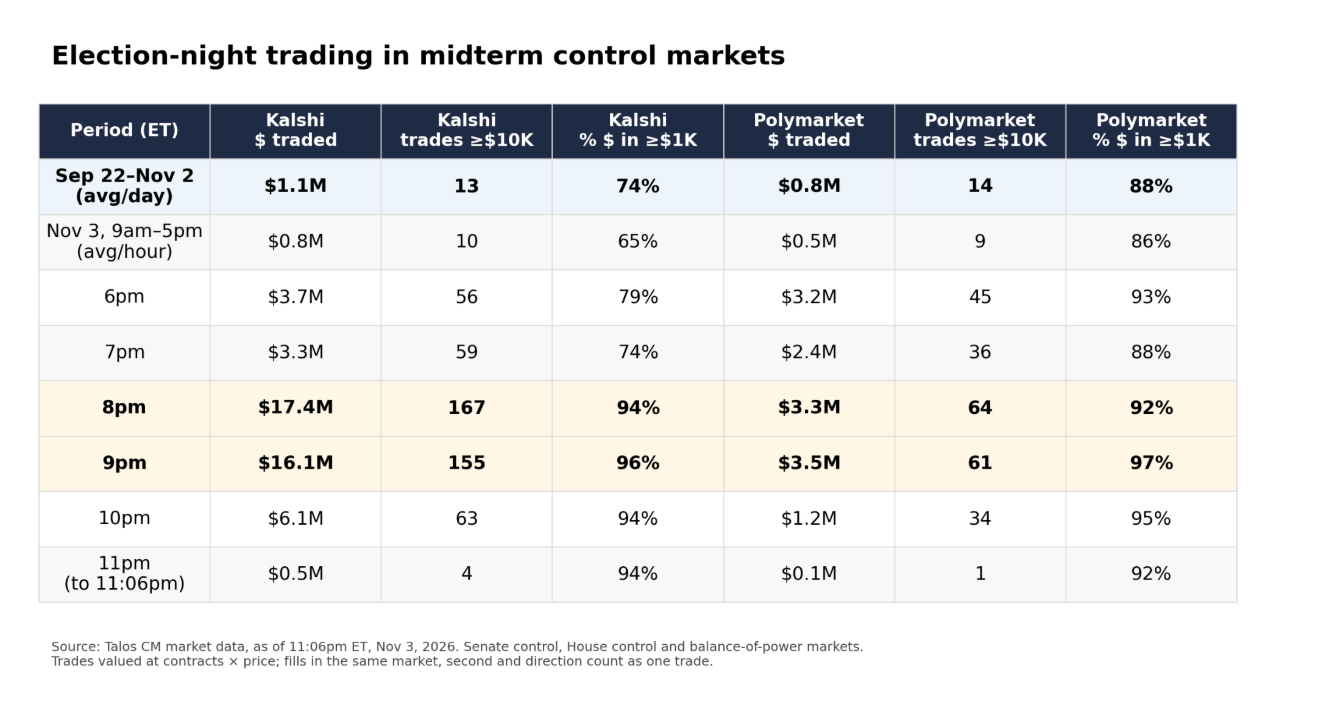
Election night was dominated by those larger trades. Kalshi traded $17.4M between 8pm and 9pm ET, against a pre-election average of $1.1M a day. That hour had 167 trades of $10K or more, against an average of 13 a day.
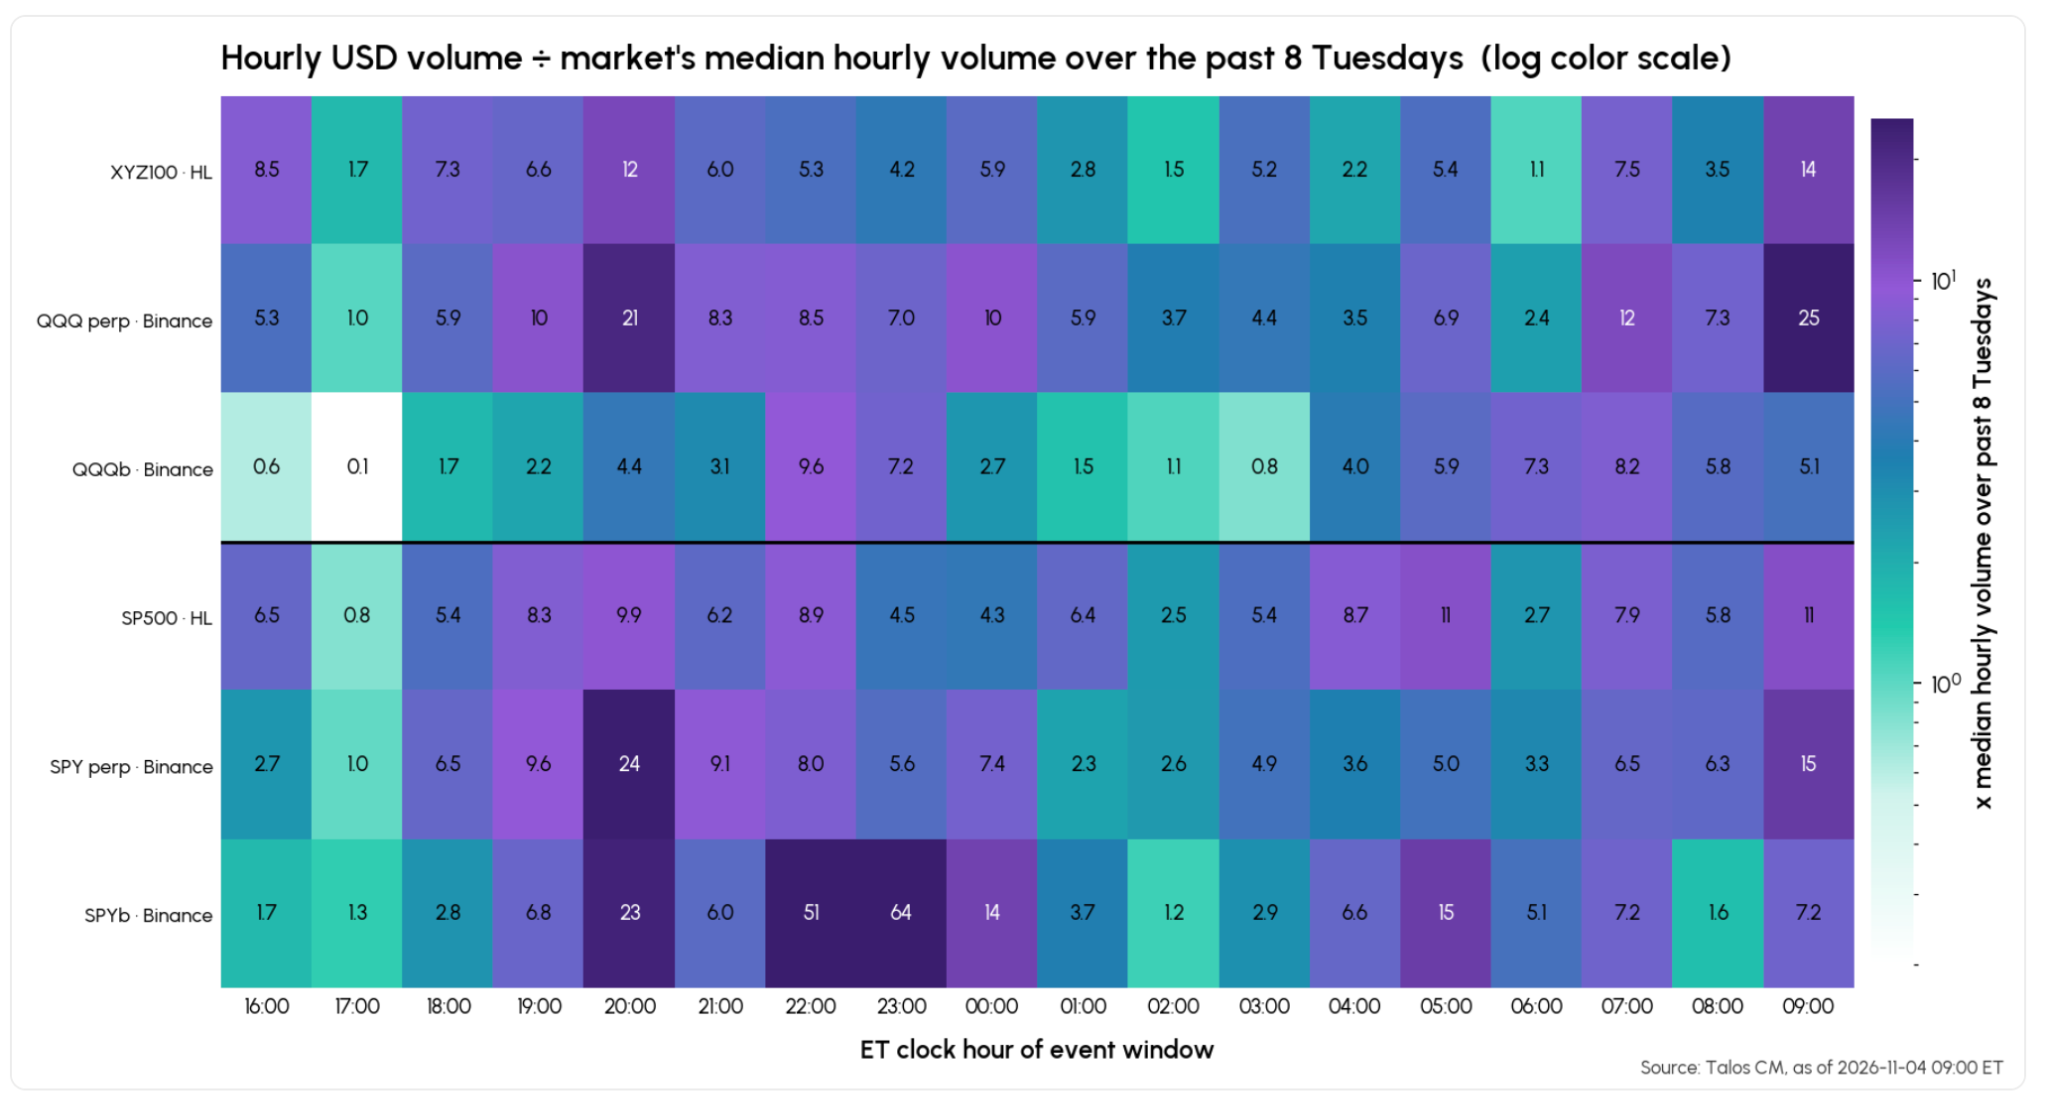
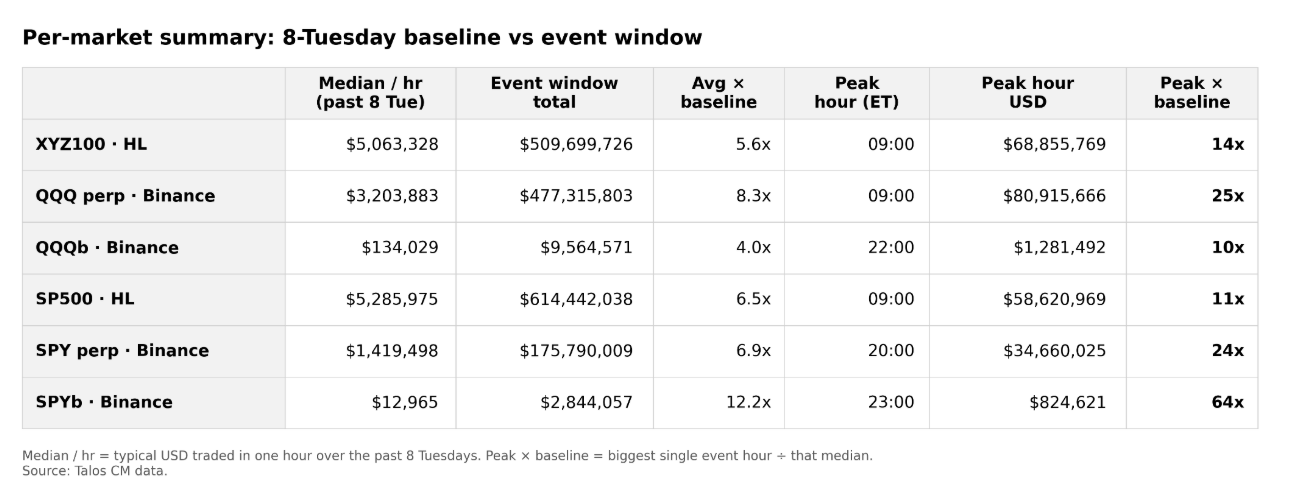
On-chain equity trading spiked in the same hour. Between 8pm and 9pm ET, Hyperliquid’s Nasdaq-100 perp traded $63M, 12x its typical hour, and Binance’s QQQ perp traded $68M, 21x. The busiest hour came at 9am ET, ahead of the cash open, when Binance’s QQQ perp traded $81M, 25x its typical hour. From Tuesday’s 4pm close to Wednesday’s 9:30am open, the Nasdaq-100 perp traded $510M, averaging 5.6x a typical hour. The Nasdaq-100 perp fell about 2.4% from Tuesday’s close by 10pm, and the S&P 500 perp fell about 1.3%. Both rebounded through the night to QQQ +0.5% / SPX +1.1% by 9:30am. The cash ETFs didn’t catch up until pre-market opened at 4am.
Source: Talos CM Market Data
Our interpretation is that prediction markets showed where conviction was, and on-chain markets showed how risk was repriced, hours before cash markets could. Neither proves large traders knew more, and some large trades are hedges.
Two recent Talos research pieces go deeper on each market.
Our October analysis of Kalshi’s Senate contracts, 50 Shades of Gray: Explore Pricing Gaps in Midterm Prediction Markets, shows how prediction markets trade differently from traditional markets. Four contract families priced the same question, Senate control, up to 9.7 points apart. Liquidity was concentrated in a few contracts, and the contracts settled on different terms. In a market this fragmented, pricing data can show where opportunities appear and where they disappear once fees and liquidity are counted.
Our research on on-chain equity trading, Stock Market that Never Sleeps: Inside the Premiums and Liquidity Gaps of Tokenized Equities, follows the most liquid tokenized stocks and equity perps after hours. In it, tokenized NVDA prices carried little signal just after the close, but the signal grew stronger overnight and into pre-market. By the open, the token had essentially matched the stock. Perps did about six times the volume of tokenized spot.
For desks and data buyers, the useful information is in trade size, timing and venue together. These figures are preliminary. We publish research like this regularly at Talos. Follow our LinkedIn or Talos Research to see the next piece.
Disclaimer: Talos Global, Inc. and its affiliates ("Talos") is not an investment advisor or broker/dealer. This information does not constitute an offer to buy or sell, or a promotion or recommendation of, any digital asset, security, derivative, commodity, financial instrument or product or trading strategy. This information is not intended to constitute investment advice or a recommendation to make (or refrain from making) any kind of investment decision and may not be relied on as such. This information is subject to change without notice. It is provided only for general informational, illustrative, and/or marketing purposes and is not intended for retail clients. The information provided was obtained from sources believed to be reliable at the time of preparation, however Talos makes no representation as to its accuracy, suitability, non-infringement of third-party rights, or otherwise. Talos disclaims all liability, expenses, or costs arising from or connected with the information provided. All content is provided for informational and illustrative purposes only. It does not represent firm offers, executable prices, or commitments of any kind, and should not be relied upon as indicative of current or future market prices or the terms on which any transaction may be executed.
Subscribe
If you’d like to get State of the Market in your inbox, please subscribe below.
Latest insights and research



Request a demo
Find out how Talos can simplify the way you interact with the digital asset markets.