


Coin Metrics State of the Network is an unbiased, weekly view of the crypto market informed by our own network (on-chain) and market data.
Key Takeaways
- USDC and USDT supply grew to over $255B in 2025 but growth has stagnated in 2026. This year, neither stablecoin has achieved greater than 10% growth in supply Month-over-Month.
- Lagged regression analysis reveals perpetual funding rates and total crypto market cap significantly explain a part of variance in weekly USDC and USDT supply growth.
- Adding carry spread to the model and comparing on-chain yields with traditional yields highlights that more USDC is minted on average when the carry spread widens, reinforcing USDC’s position as the main stablecoin integrated with DeFi and on-chain operations.
Introduction
Blockchains use stablecoins as tokens representing the stable value of user holdings. Stablecoins can be deployed in lending protocols, used to swap for other tokens, or pay for services integrated with the network. Stablecoins also reflect macroeconomic conditions – stablecoins are popular for remittance payments and accessing U.S. dollars in countries that face high inflation or currency devaluation.
How Have Stablecoins Grown So Far?
Stablecoins have existed through multiple economic regimes. In March 2023, USDC depegged after Silicon Valley Bank experienced a bank run triggered by losses on its long-term bonds, impacting a portion of USDC’s reserves. This depeg coincided with a drop in USDC supply from $56.6B in 2022 to as low as $27.9B in February 2024.
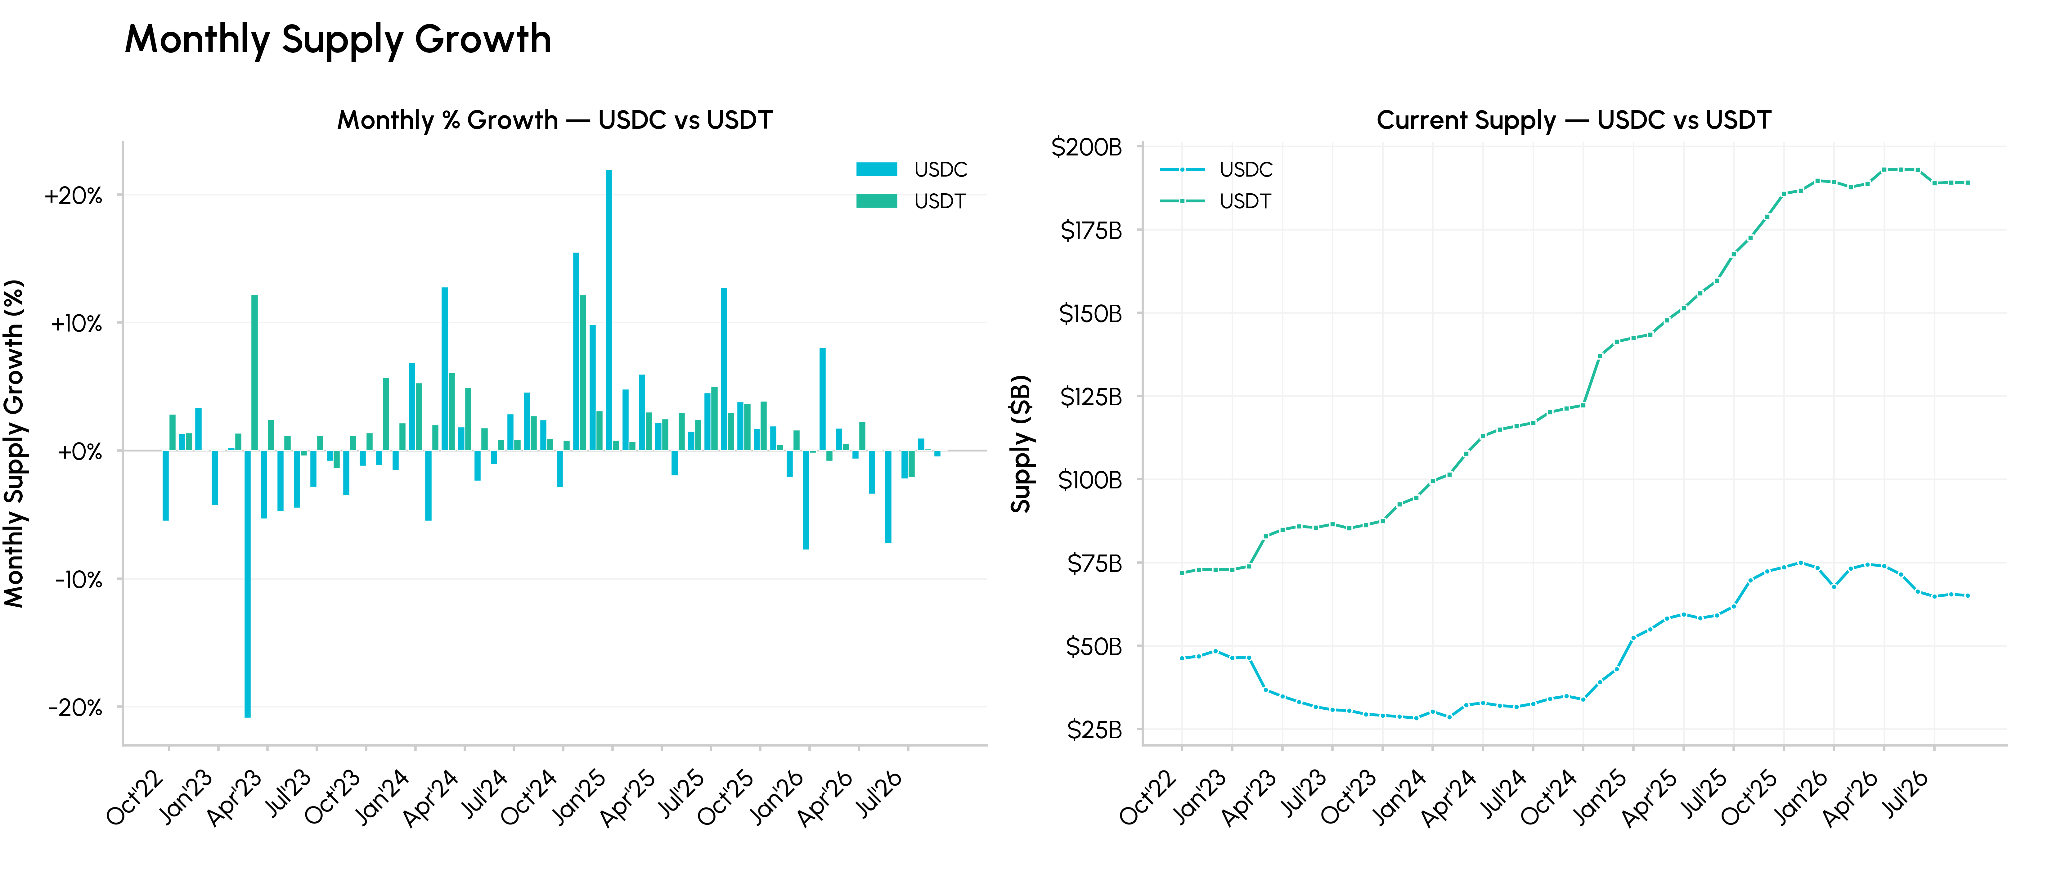
Source: Talos CM Network Data Pro
In November 2024, stablecoin supply growth accelerated as institutional demand grew. USDC recovered to its previous highs in March 2025. In 2026, stablecoin growth has stagnated as some stablecoins’ supply has declined. What made 2026’s stagnancy different from 2025’s boom? This led us to explore what factors can affect stablecoin supply growth and how much growth can be anticipated.
Regression Analysis
Not all stablecoins share the same size or distribution, and can often depend too much on too few factors to isolate drivers of supply growth. For instance, smaller stablecoins can be heavily influenced by stablecoin issuer incentives and growth can be unsustainable. We began by generalizing how USDC and USDT supply is impacted by select factors, given both have a size greater than $25B, wide distribution across networks and exchanges, and no native incentives or yield for tokenholders.
We used six variables with weekly data over the past four years to try to explain USDC and USDT stablecoin supply growth, lagging the drivers by one week. Factors included:
- Perp Funding: Average annualized funding rate level of BTC and ETH markets on the 5 largest exchanges by open interest
- Competitor Supply: Current Supply of seven other stablecoins (BUSD, TUSD, GUSD, PYUSD, EURC)
- Crypto Market Cap: Weekly % change of total crypto market cap (CapMrktCurUSD) of all non-stablecoin assets
- 2Y Yield 𝚫: Weekly difference of the Market Yield on U.S. Treasury Securities at 2-Year Constant Maturity (FRED)
- Net Liquidity Growth: Weekly % change of Fed net liquidity. Calculated as Fed Total Assets - Treasury General Account - Overnight Reverse Repos (FRED)
- Dollar Return: Weekly % change in Nominal Broad U.S. Dollar Index (FRED)
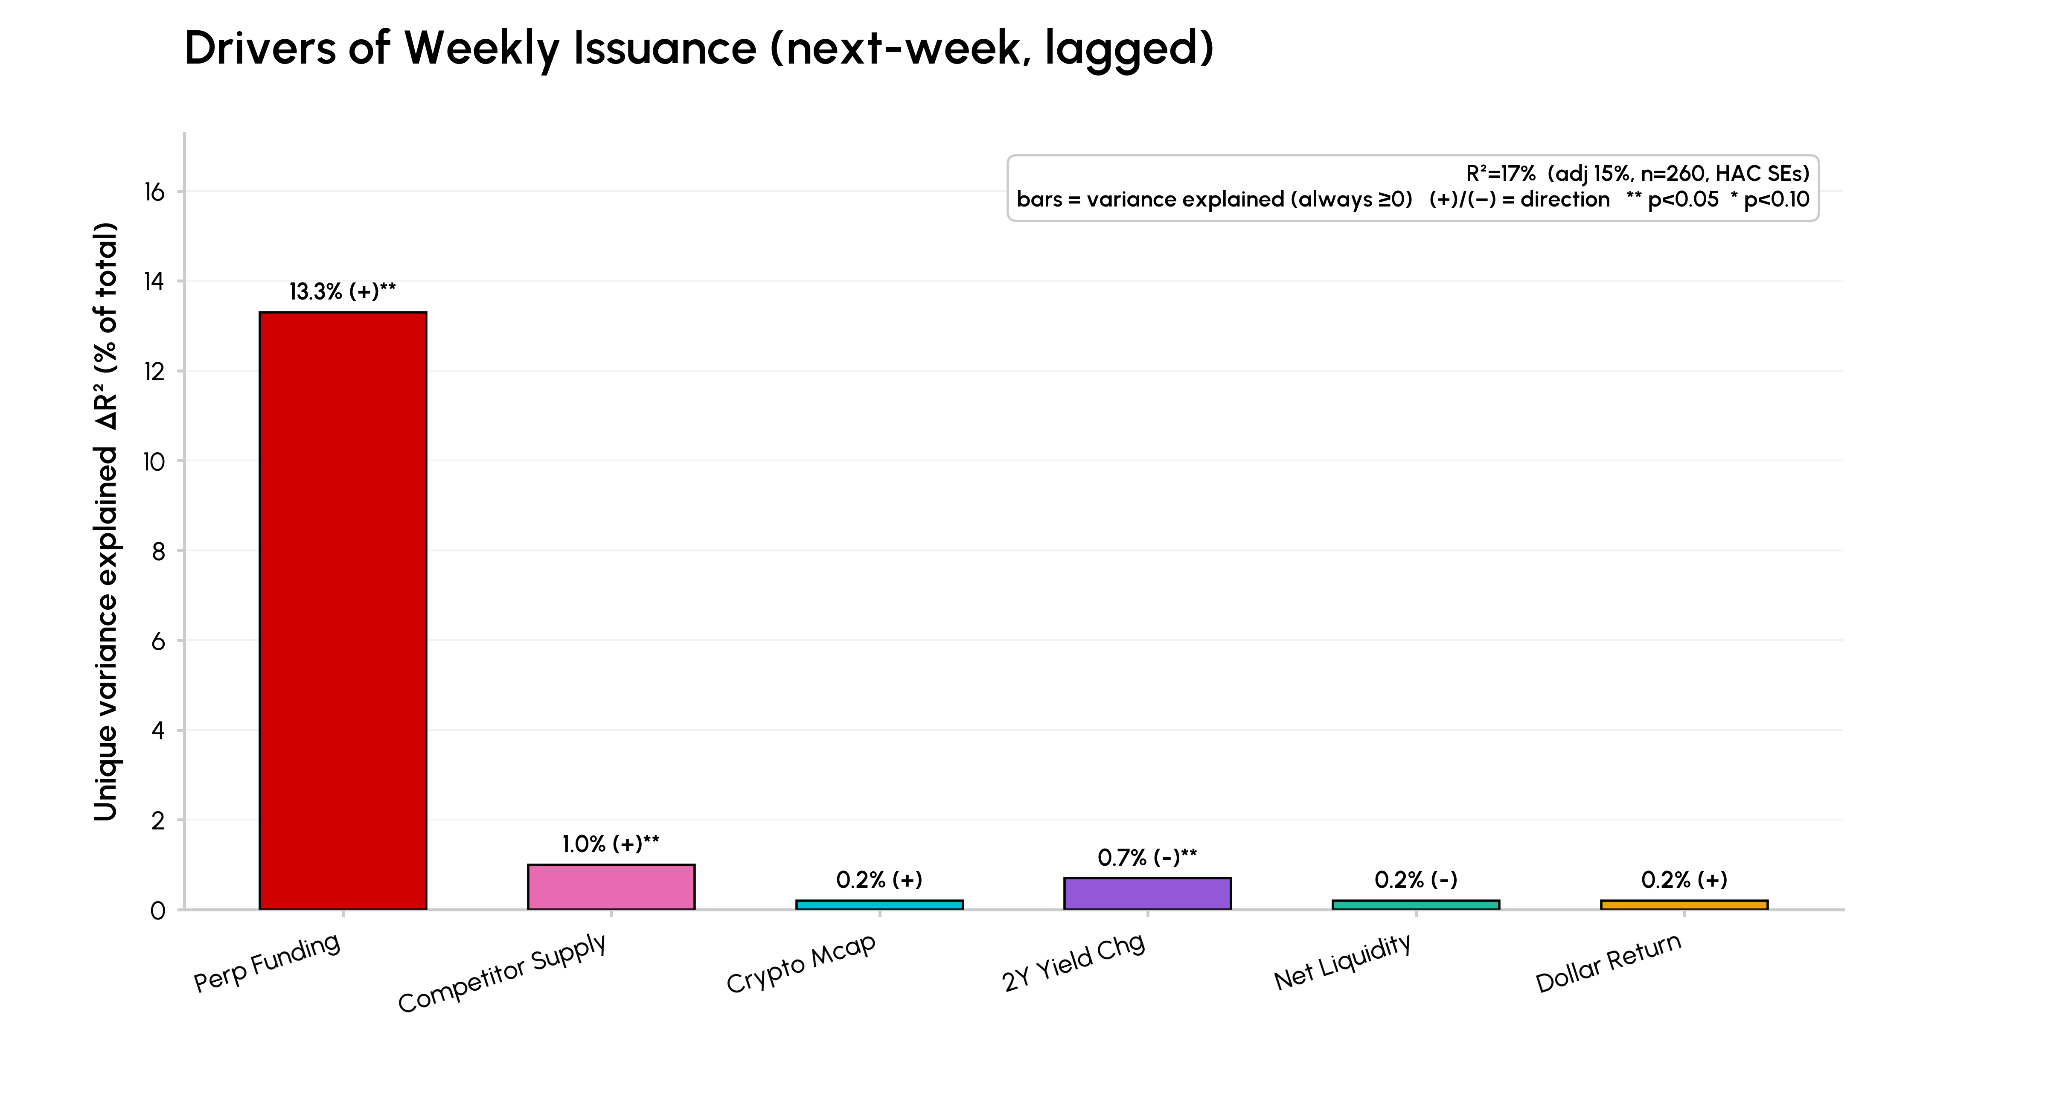
Source: Talos CM Market Data, Network Data Pro, FRED
Our initial model highlights that perp funding, competitor supply, total crypto market cap, and change in the 2-year yield are all significant at the 5% level. Perp funding rates uniquely account for 13.3% of the variability in USDC + USDT supply growth. When the annualized perpetual funding rate level across BTC and ETH increases the previous week, stablecoin supply growth on average is greater than the mean growth in the next week.
Breakdown by Stablecoin
USDC and USDT are functionally similar but differ in network distribution and geographic adoption. A deeper dive into individual stablecoin supply growth reveals factors do not impact two stablecoins the same.
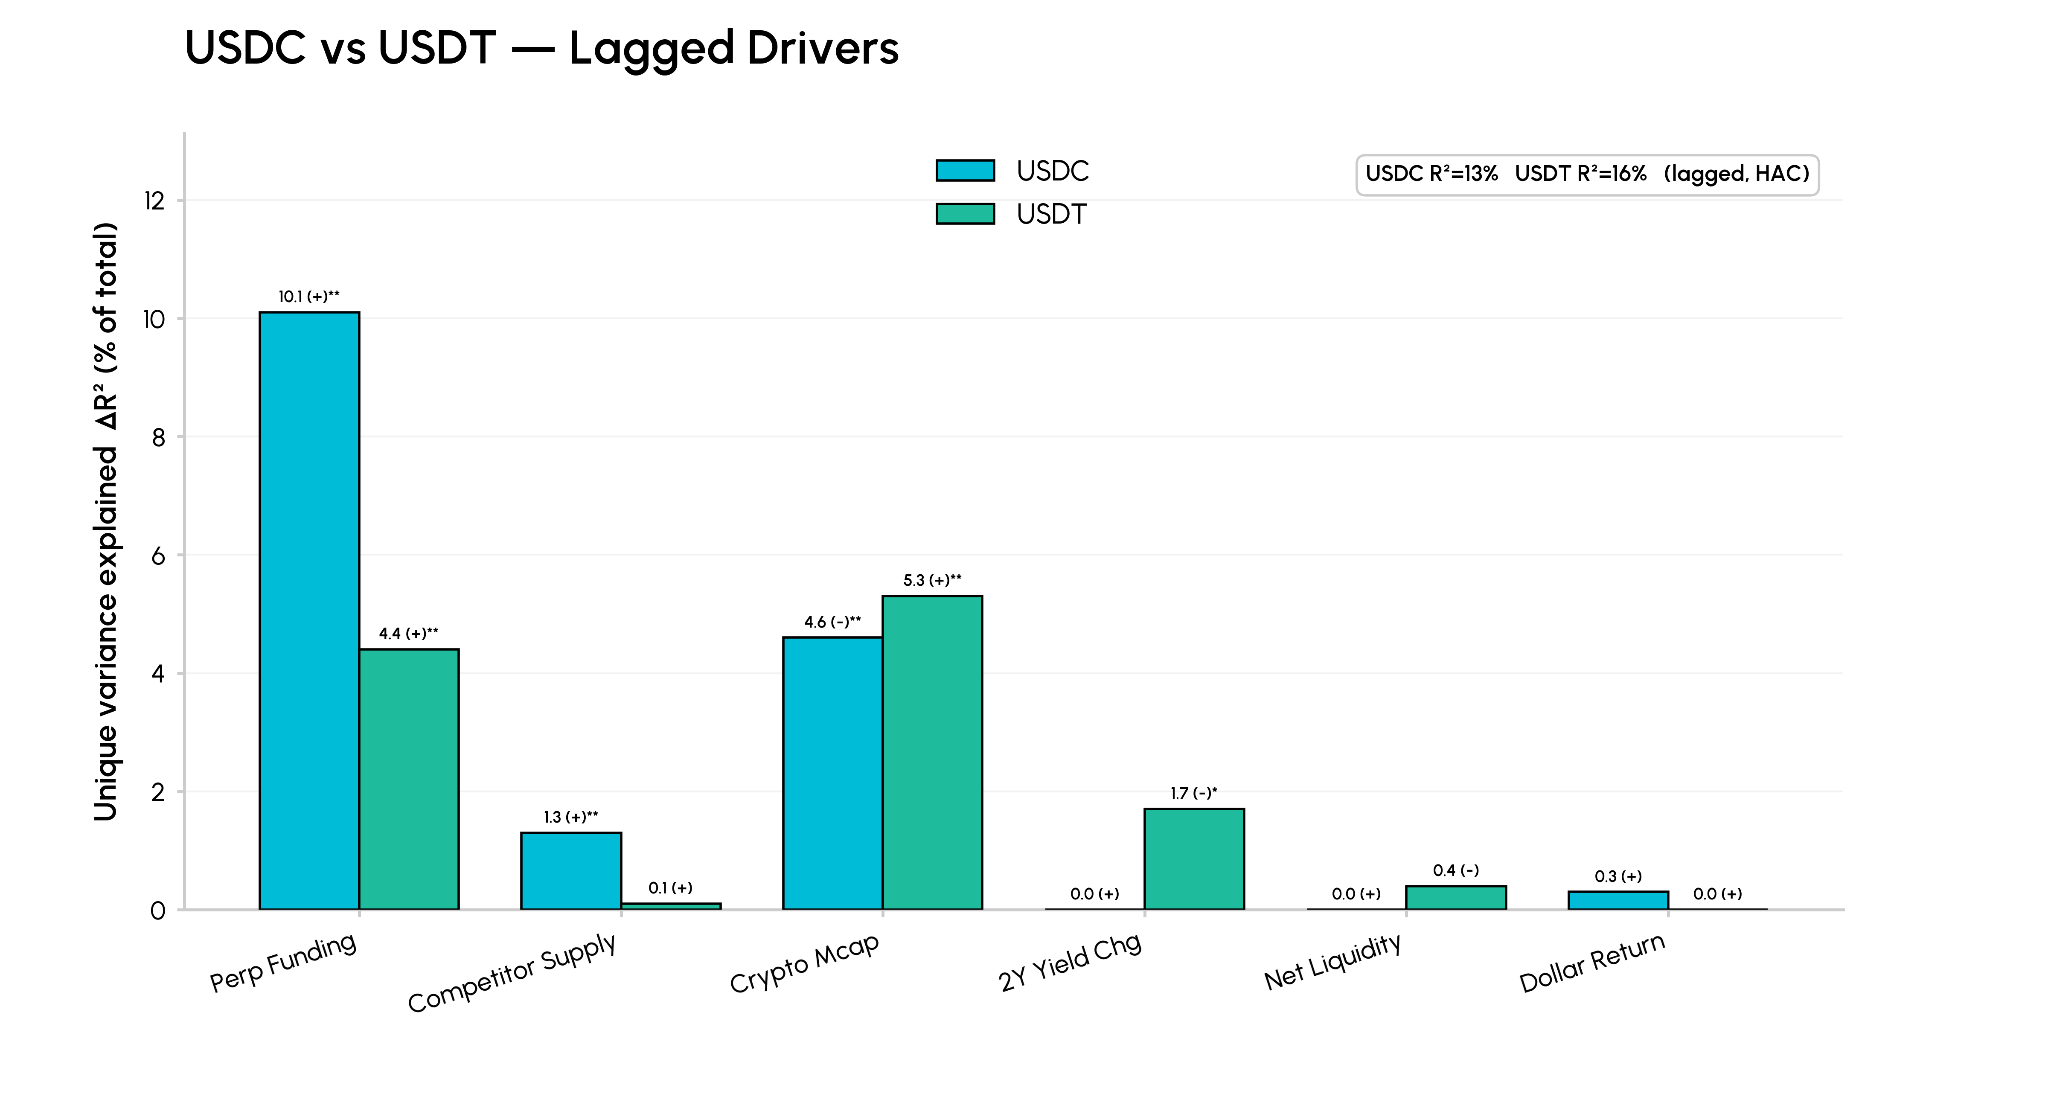
Source: Talos CM Market Data, Network Data Pro, FRED
Higher perp funding is associated with faster next-week supply growth for both USDC and USDT, and it's the single largest factor, explaining ~10% of USDC and ~4% of USDT weekly growth variance after controlling for other factors. High funding rates signal leverage demand; therefore, traders mint USDC and USDT as collateral to fund those positions. USDT is the margin asset for ~42% of futures markets, specifically the primary margin asset for most centralized exchange markets. USDC is the margin asset for ~10% of futures markets, concentrated in Hyperliquid, dYdX, and Deribit markets, highlighting USDC’s on-chain DeFi integration.
Crypto market returns are inversely associated with USDC but directly with USDT, and both are significant. Last week's return explains 4.6% of the variance in USDC weekly growth, but when crypto rises, USDC growth tends to slow the following week. For USDT it explains 5.3%, a rising market is followed by faster USDT growth. USDT expands as risk-on leverage builds, while USDC mints when markets fall. This is consistent with deleveraging and flight into USDC as dry powder and an asset for on-chain yields.
Adding Carry Spread Driver
Our initial models contained data from the previous four years to increase confidence in testing factor significance. We wanted to explore an additional factor that has been available since 2023: Carry Spread. Carry spread is equal to the difference between the stablecoin’s Aave v3 market average supply APY and the 3-month treasury bill.
The timeframe difference required us to shift our window of analysis starting in 2023. We reran the regressions, comparing the combined (USDC+USDT) model, then including carry spread, then comparing each stablecoin individually.
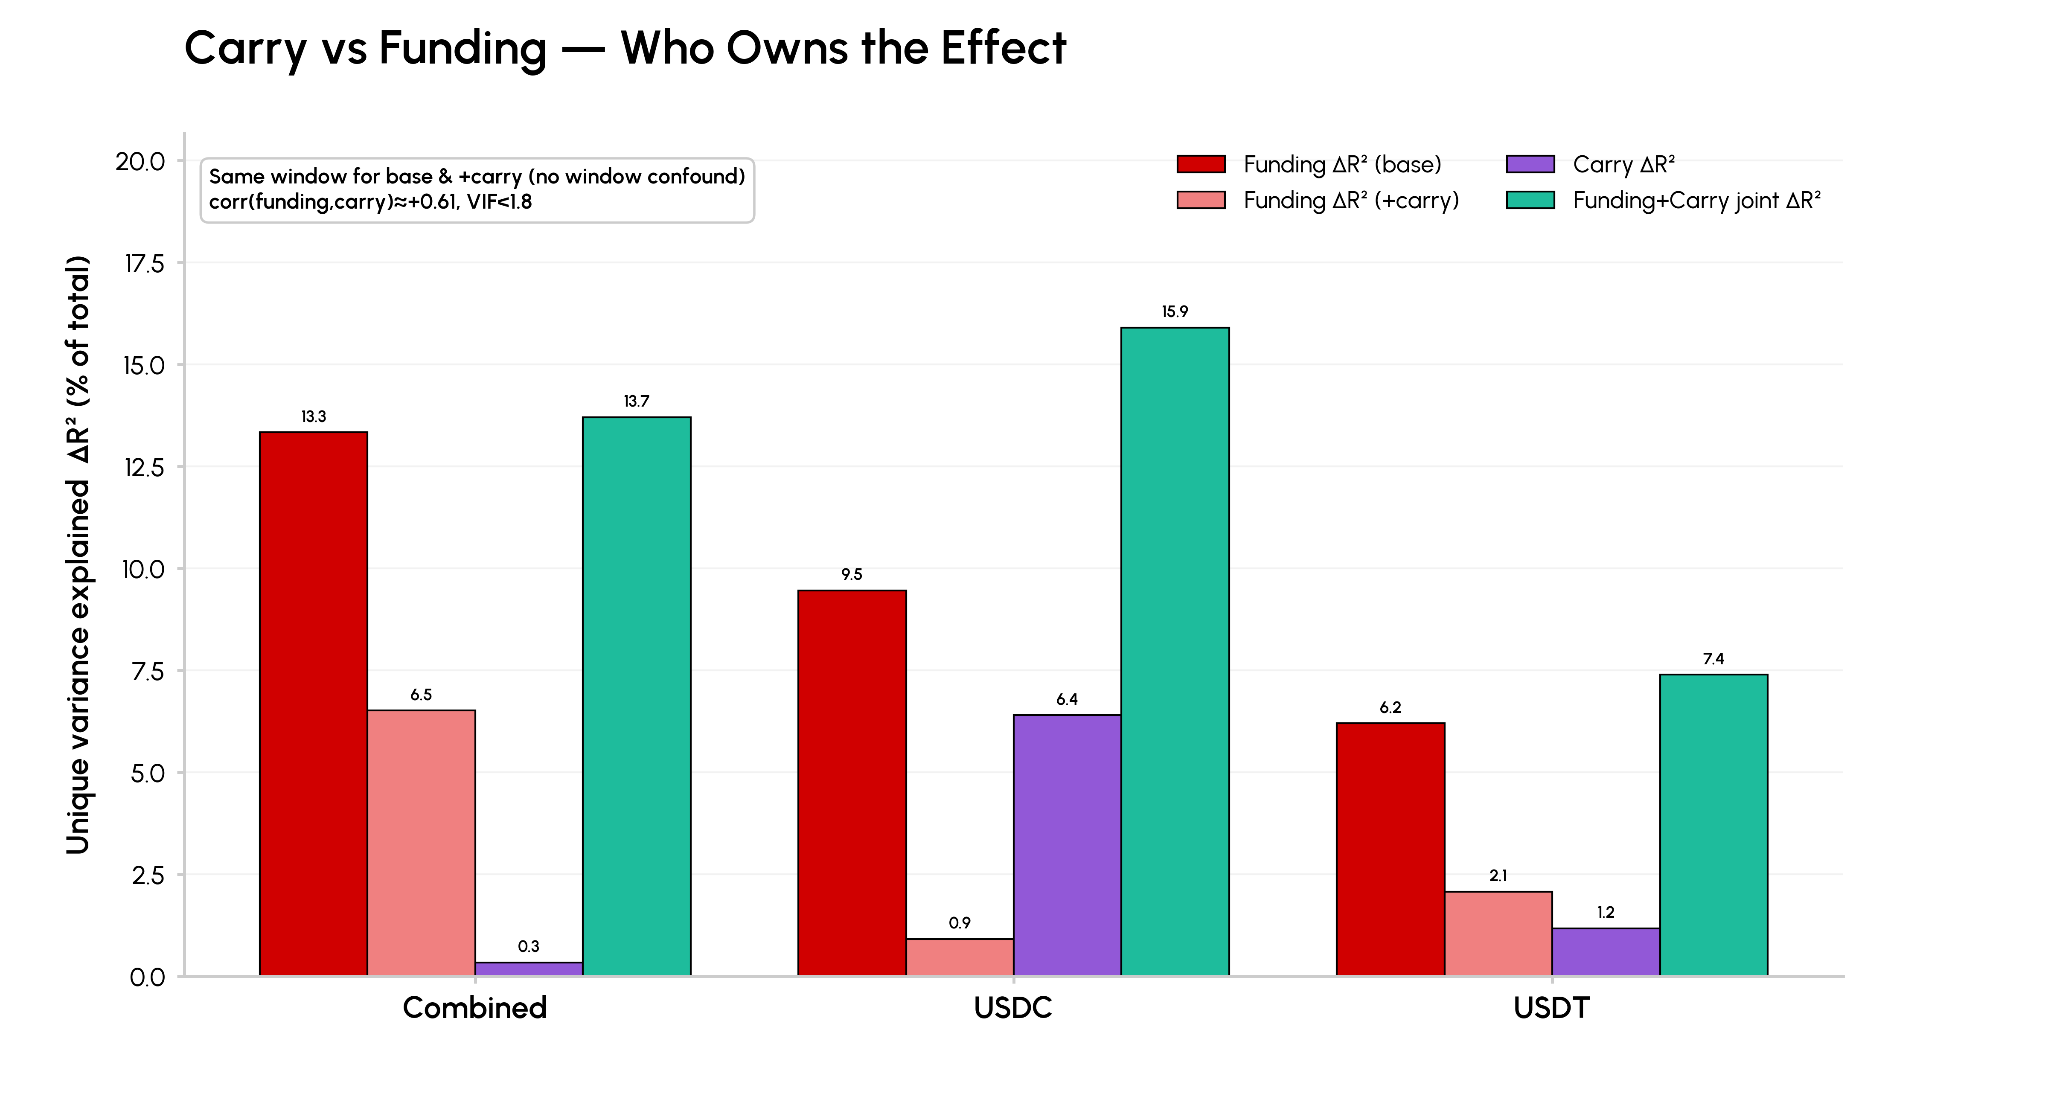
Source: Talos CM Market Data, Network Data Pro, Protocol Metrics, FRED
Carry spread and perp funding are both proxies for leverage in the system. The factors are strongly correlated with a correlation coefficient of 0.61, so we must compare whether adding carry spread to our model improves explaining stablecoin growth or if there is shared variance.
For combined and USDT individually, carry adds nothing meaningful beyond perp funding. The model just splits shared variance between them. Carry adds genuine explanation for weekly USDC supply growth at the 5% significance level. Funding and carry now explain 15.9% of the variance in USDC weekly growth. USDC is the DeFi-native collateral, so when on-chain lending yields are high, USDC is minted and supplied to capture that carry, a signal cleaner for USDC than the perp funding rate.
Did Lagging Factors Improve Analysis?
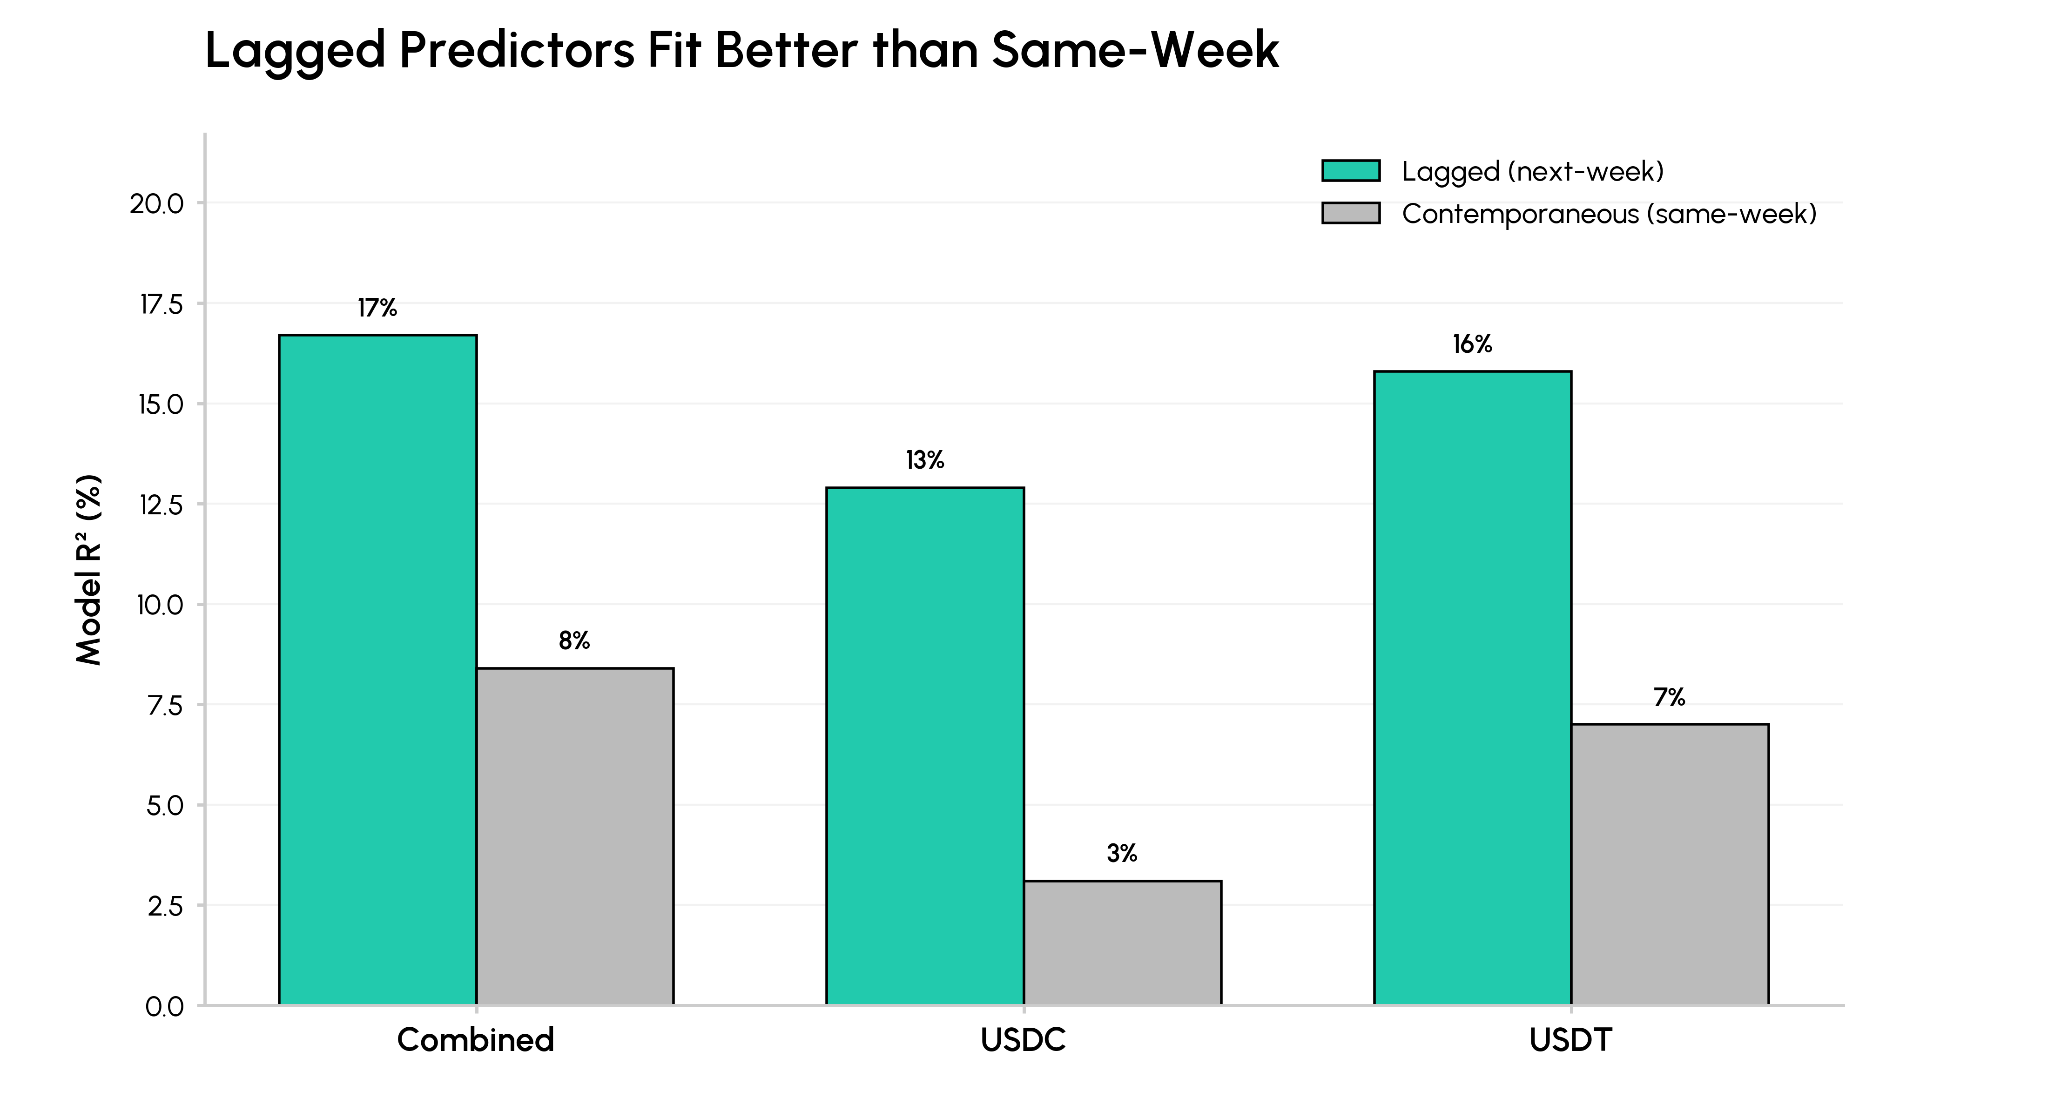
Lagging the factors with stablecoin growth supported a better fit than modeling same-week changes.
Source: Talos CM Market Data, Network Data Pro, FRED
Lagging the factors against stablecoin growth fits better than comparing same-week changes. Individually and lagged, factors explain 13% and 16% of the variance in USDC and USDT weekly growth respectively with lagged factors. The significant factors precede supply moves which also argues the relationship is factor drives supply rather than the reverse.
Still, a large share of variance stays unexplained. No model explains more than 25% of the variance in stablecoin growth, reflecting idiosyncratic drivers we don't capture such as issuer treasury operations, mint/redemption incentives, on and off-ramp integrations, and regulation in different jurisdictions.
Conclusion
While none of the models explain more than 25% of the change in stablecoin supply growth, on-chain factors including perp funding rates, carry spread, and total crypto market cap are significant factors explaining a portion of the variance in USDC and USDT weekly supply growth.
Crypto moves fast and one of the challenges with historical models is understanding regime changes. Including 2022 means including the implosion of FTX, Celsius, and Three Arrows Capital, shocks to industry. More recent models are more aligned with the institutional capital entering the industry. As institutions continue to adopt blockchain rails, new factors could provide more insight as to what drives stablecoin supply growth.
Subscribe and Past Issues
Coin Metrics State of the Network is an unbiased, weekly view of the crypto market informed by our own network (on-chain) and market data.
If you'd like to get State of the Network in your inbox, please subscribe here. You can see previous issues of State of the Network here.
Disclaimer: The information herein is provided for informational purposes only. Talos Trading, LLC and its affiliates (“Talos”) does not give any representations or warranties in relation to the accuracy, validity, or completeness of the information of this material, including without limitation the factual information obtained from publicly available sources considered by Talos to be reliable at the time. Talos accepts no liability for any consequences of using the information contained in this material. Any opinions or estimates expressed herein reflect a judgment made by the author(s) as of the date of publication and are subject to change without notice. Neither this material nor any copy thereof may be taken, reproduced, or redistributed, directly or indirectly, without Talos’s prior written permission. Any views or opinions expressed are those of the authors and do not necessarily reflect the views of Talos. This communication does not constitute an offer to buy or sell, or a promotion or recommendation of, any digital asset, security, derivative, commodity, financial instrument, or product or trading strategy. This document and information are not intended to constitute investment advice or a recommendation to make (or refrain from making) any kind of investment decision and may not be relied on as such.
Latest insights and research




Request a demo
Find out how Talos can simplify the way you interact with the digital asset markets.